


Introduction
As more companies depend on networked systems, effective monitoring becomes increasingly crucial. Network outages, server failures, or application issues can seriously disrupt business operations and may lead to financial losses ranging from thousands to millions of USD. To minimize or prevent such incidents, robust monitoring systems are essential. This article introduces OMD – Checkmk, an open-source monitoring solution offering reliable alerting and visualization—ideal for mid-sized environments that don’t want to invest heavily in monitoring infrastructure.

1. What Are OMD and Checkmk?
OMD (Open Monitoring Distribution) is a project launched in 2010 by Mathias Kettner. It uses Nagios Core at its core, bundled with open-source tools like Check_MK, NagVis, PNP4Nagios, DocuWiki, etc., to offer a flexible and integrated monitoring stack .
Check_MK, introduced in 2008 as a plugin for Nagios Core, is now a key component of OMD. There are two main editions:
- Check_MK Raw Edition (CRE) – fully open-source
- Check_MK Enterprise Edition (CEE) – commercial with additional features
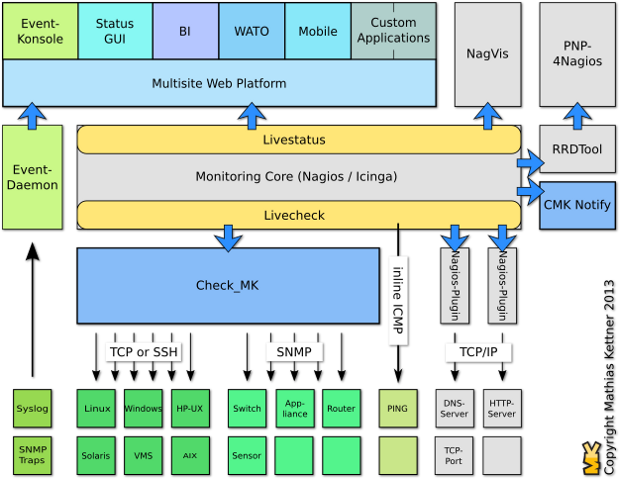
2. Architectural Advantages of OMD
OMD addresses several limitations present in vanilla Nagios by integrating tools that enhance ease of use and performance
Simple Installation
You can install a complete monitoring stack with a single command using OMD—it takes about 10 minutes.
Performance Improvements
Check_MK introduces two major modules to enhance performance:
- Livestatus:
- Interfaces with Nagios via Event Broker APIs but does not write to disk; instead, it provides a socket for on-demand data retrieval.
- Low CPU usage, no impact on disk I/O, and works without a database or extra configuration .
- Livecheck:
- Utilizes helper processes communicating via Unix sockets.
- Only the helper is forked (not the entire Nagios core), allowing distribution across CPUs.
- Keeps the helper process around just 100 KB in size .
These components allow Checkmk to scale efficiently, enabling monitoring of many systems from a single Nagios core.
3. Installing Check_MK on CentOS 7
- Check the latest releases (this example uses 1.5.0p13).
- Install prerequisites:
yum install -y epel-release wget- Download the RPM:
wget https://mathias-kettner.de/support/1.5.0p13/check-mk-raw-1.5.0p13-el7-38.x86_64.rpm- Install the RPM and dependencies:
yum install -y check-mk-raw-1.5.0p13-el7-38.x86_64.rpm- Create a new monitoring site:
omd create congdonglinux- Set the cmkadmin password:
htpasswd -m /omd/sites/congdonglinux/etc/htpasswd cmkadmin- Start the site:
omd start congdonglinux- Visit http://<server-ip>/, then log in using cmkadmin and the password you created. Installation on CentOS 7 is now complete.4.
4. Installing Check_MK on Ubuntu 16.04
wget https://mathias-kettner.de/support/1.5.0p13/check-mk-raw-1.5.0p13_0.xenial_amd64.debInstall gdebi to handle dependencies:
apt install gdebi-core -y- Install Check_MK:
gdebi check-mk-raw-1.5.0p13_0.xenial_amd64.deb- After installation, repeat CentOS steps:
- Create a site: omd create congdonglinux
- Set password
- Start site
- Log in via browser


Read more: How to Install Checkmk Using Docker Compose: A Step-by-Step Guide
Conclusion
This article introduced Checkmk and guided you through installation on CentOS 7 and Ubuntu 16.04. In the next part, we’ll demonstrate how to collect basic metrics for monitoring. Stay tuned!
Top 10 VPN Services in 2025: Secure, Fast & Feature-Rich
Hướng dẫn cài đặt Cluster Kafka trên Ubuntu
https://forum.congdonglinux.com
Add Comment