Kiến Thức Linux Logging

hướng dẫn triển khai EFK

efk-docker-congdonglinux

Table of Contents

Giới Thiệu

Giám sát và phân tích Log ngày càng trở nên quan trọng cho cả ứng dụng, máy chủ hay thậm chí là nền tảng Container. Một trong những phần mềm phổ biến nhất để phân tích và theo dõi nhật ký mà bạn có thể chọn là Elasticsearch, Fluentd và Kibana (EFK stack).

EFK là một công cụ tìm kiếm phân tán và có thể mở rộng cho phép phân tích và tìm kiếm có cấu trúc. Trong hướng dẫn này, bạn sẽ học cách thiết lập theo dõi nhật ký  EFK với Docker và lưu trữ logs của Container tập trung vào EFK này.

Yêu Cầu

  • Server Debian 11: >= 6Gb Ram
  • Đã cài Docker CE
  • Đã cài Docker Compose

Cài đặt EFK Stack

EKF là một trong nền tảng hỗ trợ khá tốt trong việc quản lý logs tập trung cho hạ tầng Container và On-premes. Trước khi bắt đầu quá trình cài đặt, chúng ta sẽ đi qua một vài cấu hình cho docker như sau:

Đối với ví dụ này, bạn sẽ sử dụng hình ảnh Docker với các thông số kỹ thuật sau:

  • Elasticsearch 7.17.0
  • Kibana 7.17.0
  • Fluentd bản Custom image dựa trên v1.14.1

Để tiến hành thiết lập EFK ta thực hiện:

1. Truy cập vào server

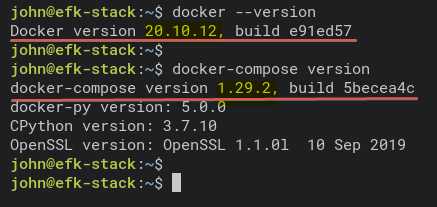
2. Xác minh lại Docker và Docker compose đã được cài đặt chưa

# Checking Docker version
docker --version

# Checking docker-compose version
docker-compose version
efk-docker-congdonglinux-01

3. Tạo thư mục

mkdir -p ~/efk; cd ~/efk

4. Tạo file cấu hình docker-compose.yml

Copy nội dung sau vào file vừa tạo.

version: "3"

# Define the Docker volume named esdata for the Elasticsearch container.
volumes:
  esdata:

# Deploying three container services (fluentd, elasticsearch, and kibana)
services:
	# Deploy using the custom image automatically be created during the build process.
  fluentd: 
    build: ./fluentd
    links: # Sends incoming logs to the elasticsearch container.
      - elasticsearch
    depends_on:
      - elasticsearch
    ports: # Exposes the port 24224 on both TCP and UDP protocol for log aggregation
      - 24224:24224
      - 24224:24224/udp

	# Created using the Docker image elasticsearch:7.17.0
  elasticsearch:
    image: elasticsearch:7.17.0
    expose: # Exposes the default port 9200
      - 9200
    environment:
      - discovery.type=single-node # Runs as a single-node
    volumes: # Stores elasticsearch data locally on the esdata Docker volume
      - esdata:/usr/share/elasticsearch/data

	# Created using the Docker image kibana:7.17.0
  kibana:
    image: kibana:7.17.0
    links: # Links kibana service to the elasticsearch container
      - elasticsearch
    depends_on:
      - elasticsearch
    ports: # Runs kibana service on default port 5601
      - 5601:5601
    environment: # Defined host configuration
      - ELASTICSEARCH_HOSTS=http://elasticsearch:9200

5. Tạo thư mục fluentd

mkdir -p fluentd/; cd fluentd/

6. Tạo tiếp file Dockerfile  tại đường dẫn: ~/efk/fluentd/Dockerfile

# image based on fluentd v1.14-1
FROM fluentd:v1.14-1

# Use root account to use apk
USER root

# below RUN includes plugin as examples elasticsearch is not required# you may customize including plugins as you wish
RUN apk add --no-cache --update --virtual .build-deps \
        sudo build-base ruby-dev \
&& gem uninstall -I elasticsearch \
&& gem install elasticsearch -v 7.17.0 \
&& sudo gem install fluent-plugin-elasticsearch \
&& sudo gem sources --clear-all \
&& apk del .build-deps \
&& rm -rf /tmp/* /var/tmp/* /usr/lib/ruby/gems/*/cache/*.gem

# copy fluentd configuration from host image
COPY ./conf/fluent.conf /fluentd/etc/
# copy binary start file
COPY entrypoint.sh /bin/

RUN chmod +x /bin/entrypoint.sh

USER fluent

7. Tiếp theo, tạo thêm 1 file entrypoint.sh trong ~/efk/fluentd/entrypoint.sh

#!/bin/sh

#source vars if file exists
DEFAULT=/etc/default/fluentd

if [ -r $DEFAULT ]; then
    set -o allexport
    . $DEFAULT
    set +o allexport
fi

# If the user has supplied only arguments append them to `fluentd` commandif [ "${1#-}" != "$1" ]; then
    set -- fluentd "$@"
fi

# If user does not supply config file or plugins, use the defaultif [ "$1" = "fluentd" ]; then
    if ! echo $@ | grep -e ' \-c' -e ' \-\-config' ; then
      set -- "$@" --config /fluentd/etc/${FLUENTD_CONF}
    fi

    if ! echo $@ | grep -e ' \-p' -e ' \-\-plugin' ; then
      set -- "$@" --plugin /fluentd/plugins
    fi
fi

exec "$@"

8. Tạo thư mục conf tại : ~/efk/fluentd/conf

mkdir -p conf

9. Tạo tiếp file cấu hình cho fluent tại ~/efk/fluentd/conf/fluent.conf

# bind fluentd on IP 0.0.0.0
# port 24224
<source>
  @type forward
  port 24224
  bind 0.0.0.0
</source>

# sendlog to the elasticsearch
# the host must match to the elasticsearch
# container service
<match *.**>
  @type copy
  <store>
    @type elasticsearch
    host elasticsearch
    port 9200
    logstash_format true
    logstash_prefix fluentd
    logstash_dateformat %Y%m%d
    include_tag_key true
    type_name access_log
    tag_key @log_name
    flush_interval 300s
  </store>
  <store>
    @type stdout
  </store>
</match>

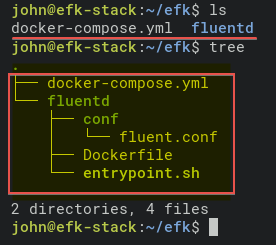
10. Cuối cùng, kiểm tra lại cấu trúc thư mục.

# Checking list of files and directory
ls
# Checking directory structure
tree
Ta sẽ thấy Output như sau

efk-docker-congdonglinux-02

Triển khai EFK với Docker

1.Truy cập vào folder efk

cd ~/efk/

2. Chạy lệnh docker-compose

docker-compose up -d

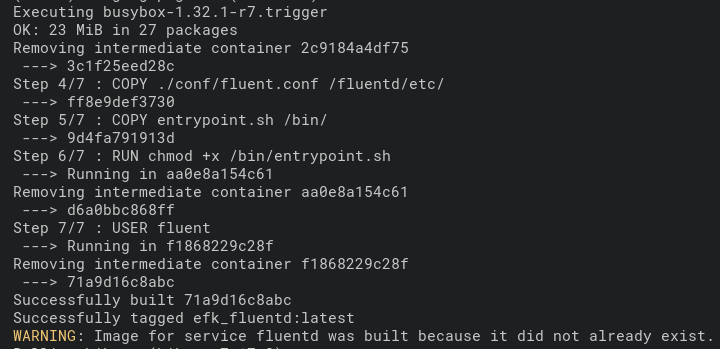
Quá trình build các images docker diễn ra.

efk-docker-congdonglinux-03

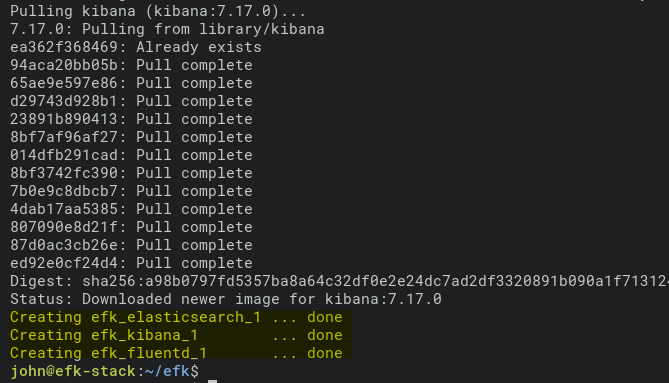
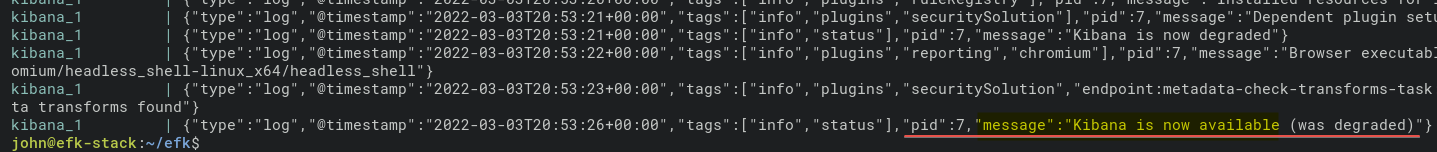
Sau khi quá trình triển khai hoàn tất, ta sẽ thấy output như sau:

efk-docker-congdonglinux-04

3. Kiểm tra logs EFK

# Checking logs for service fluentd
docker-compose logs fluentd

# Checking logs for service kibana
docker-compose logs kibana
efk-docker-congdonglinux-05
Checking log messages from the kibana service


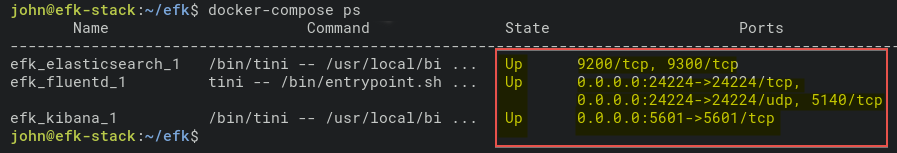
4. Kiểm tra trạng thái của tất cả container

docker-compose ps
Checking EFK Stack Container Services

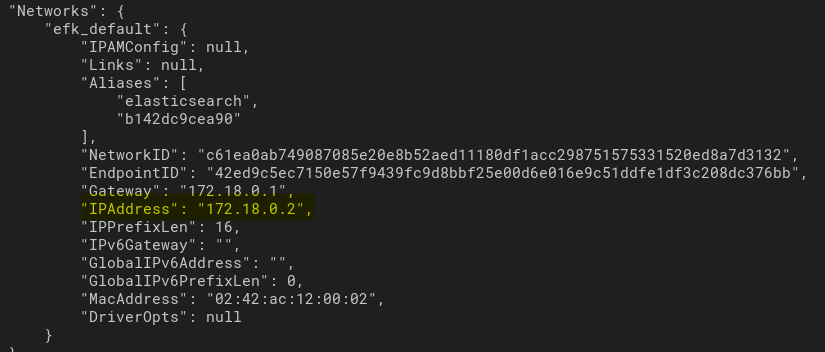
5. Xem chi tiết thông tin của container efk_elasticsearch

docker inspect efk_elasticsearch_1

Tại đây, chúng ta sẽ có thể tìm thấy IP của container efk_elasticsearch_1 , ví dụ 172.18.0.2.

Checking Network Settings of the elasticsearch service

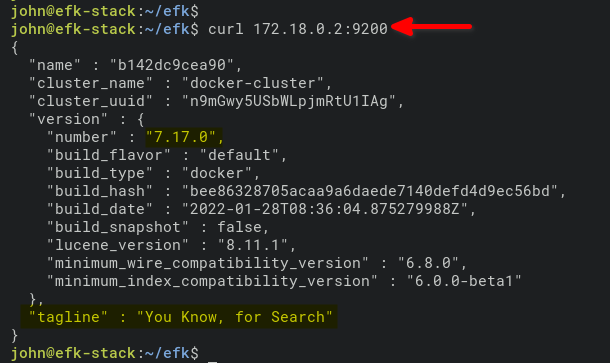
6. Truy cập và xác minh container elasticsearch

curl 172.18.0.2:9200
Output
Checking elasticsearch Service Status

Cấu hình Kibana Index Pattern

Sau khi đã hoàn tất quá trình triển khai EFK. Tiến hành mở trình duyệt và truy cập vào web của Kibana.

1.Mở trình duyệt và nhập vào IP và port kibana ( mặc định 5601). ví dụ: http://172.16.1.10:5601)

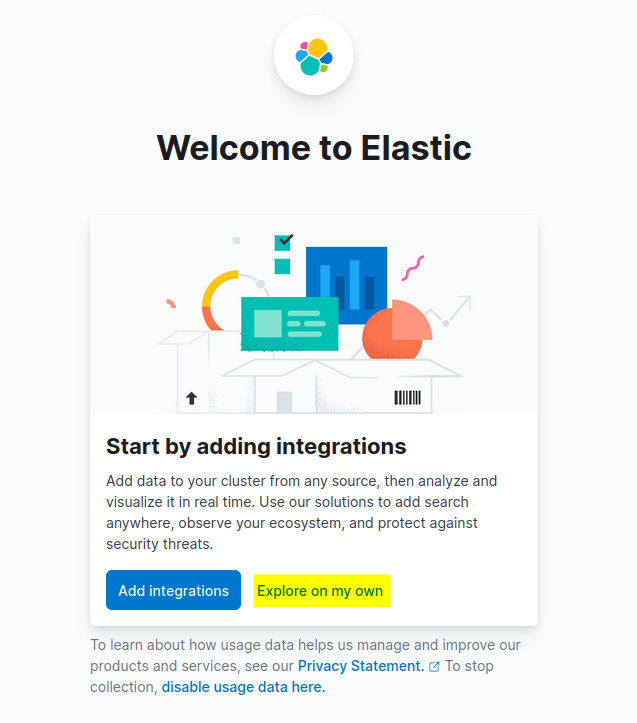
2. Tiếp theo, chọn vào “Explore on my own”

Elastic Kibana Welcome Page

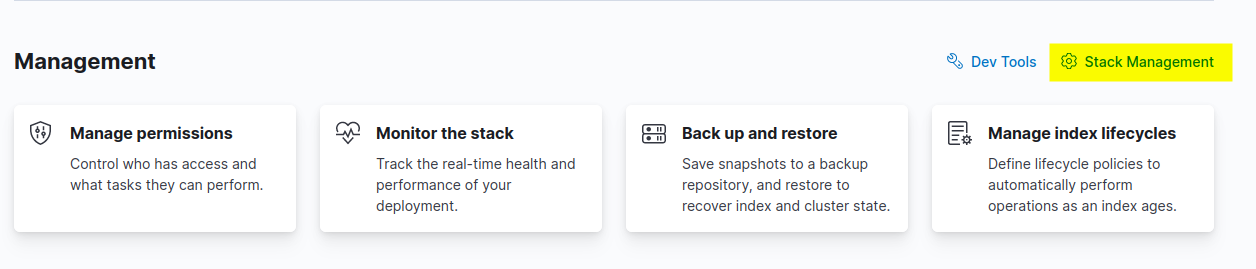
3. Chọn vào “Stack Management”

Accessing the Stack Management

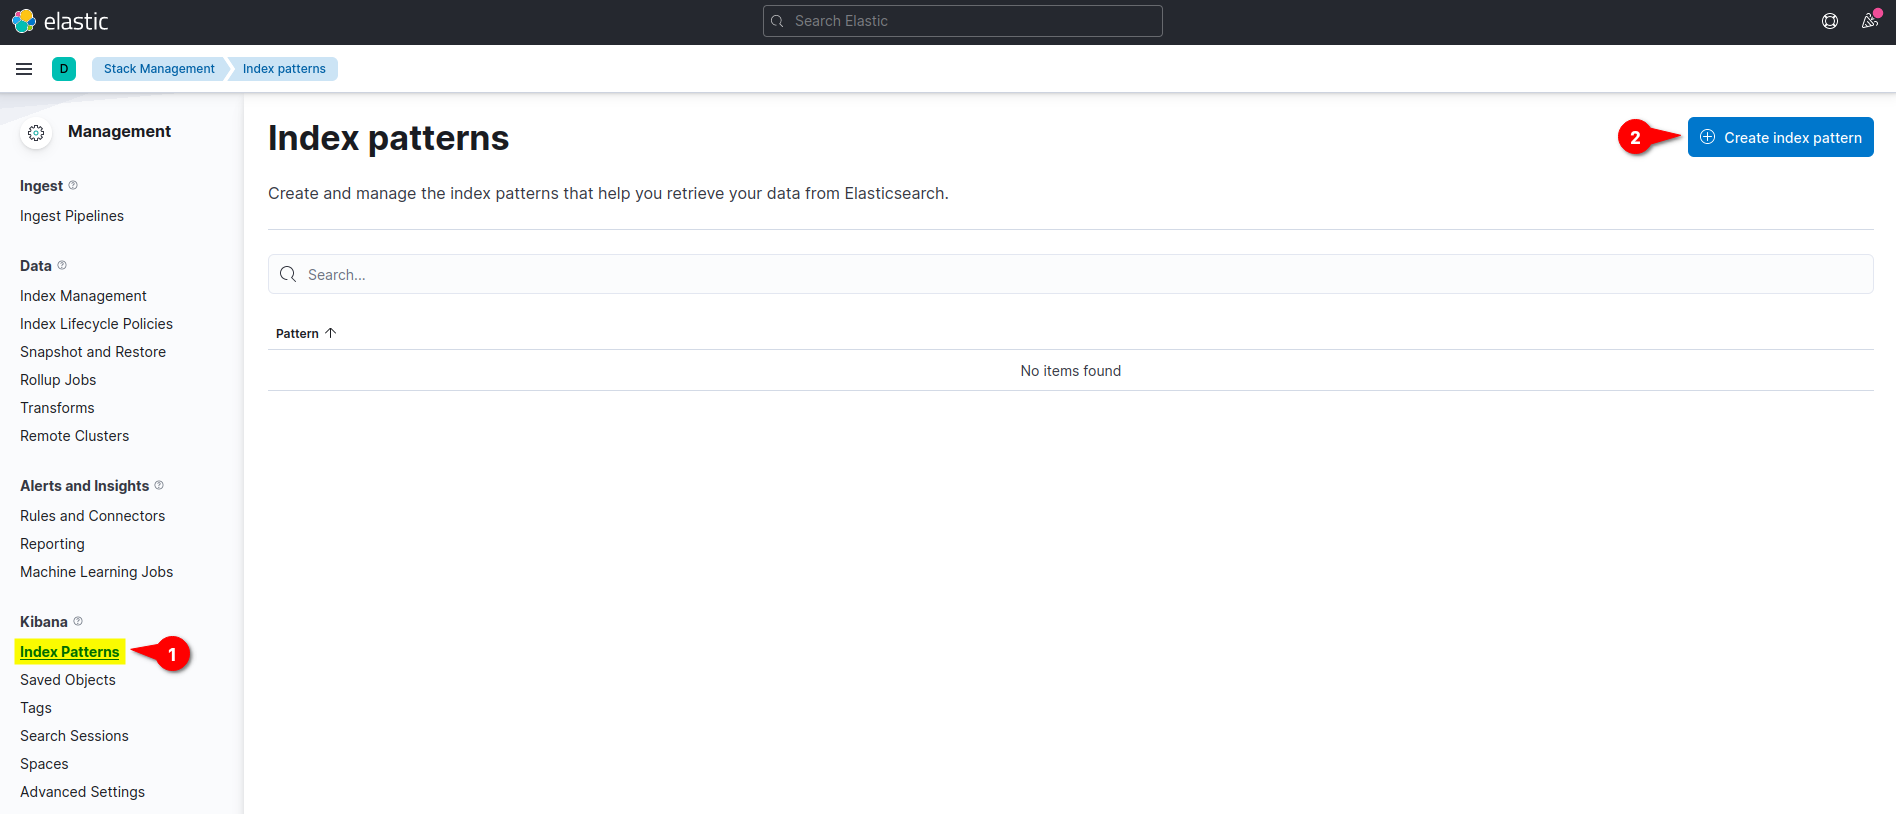
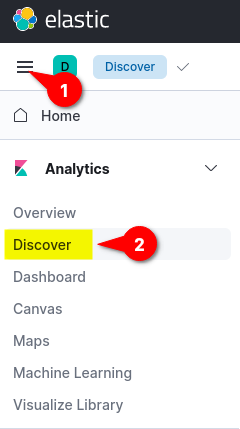
4. Bên phía gốc trái Kibana, chọn vào Index Patterns  và nhấp vào nút  Create Index Pattern

Creating New Index Pattern

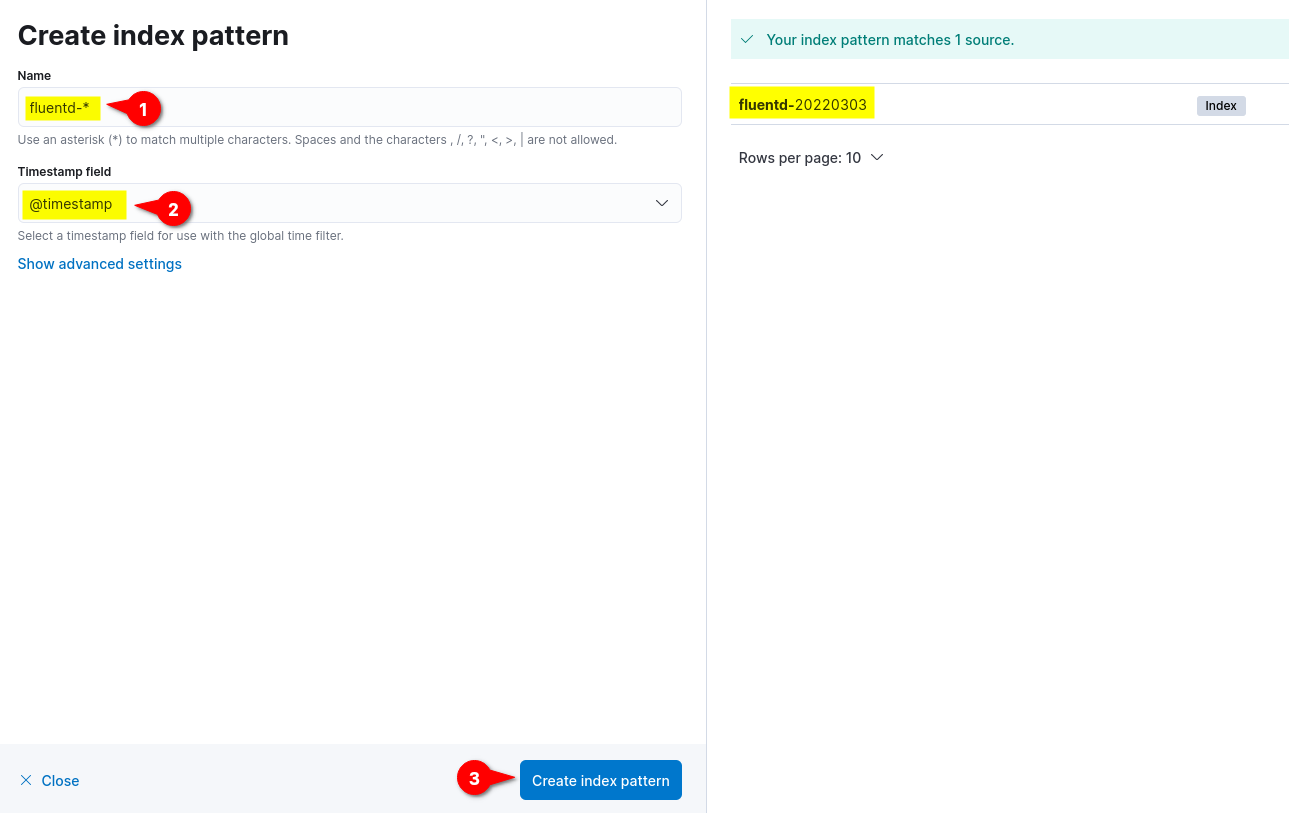
5. Nhập vào Name , thiết lập Timestamp field@timestamp, và chọn vào nút Create index pattern

Creating an Index Pattern for fluentd

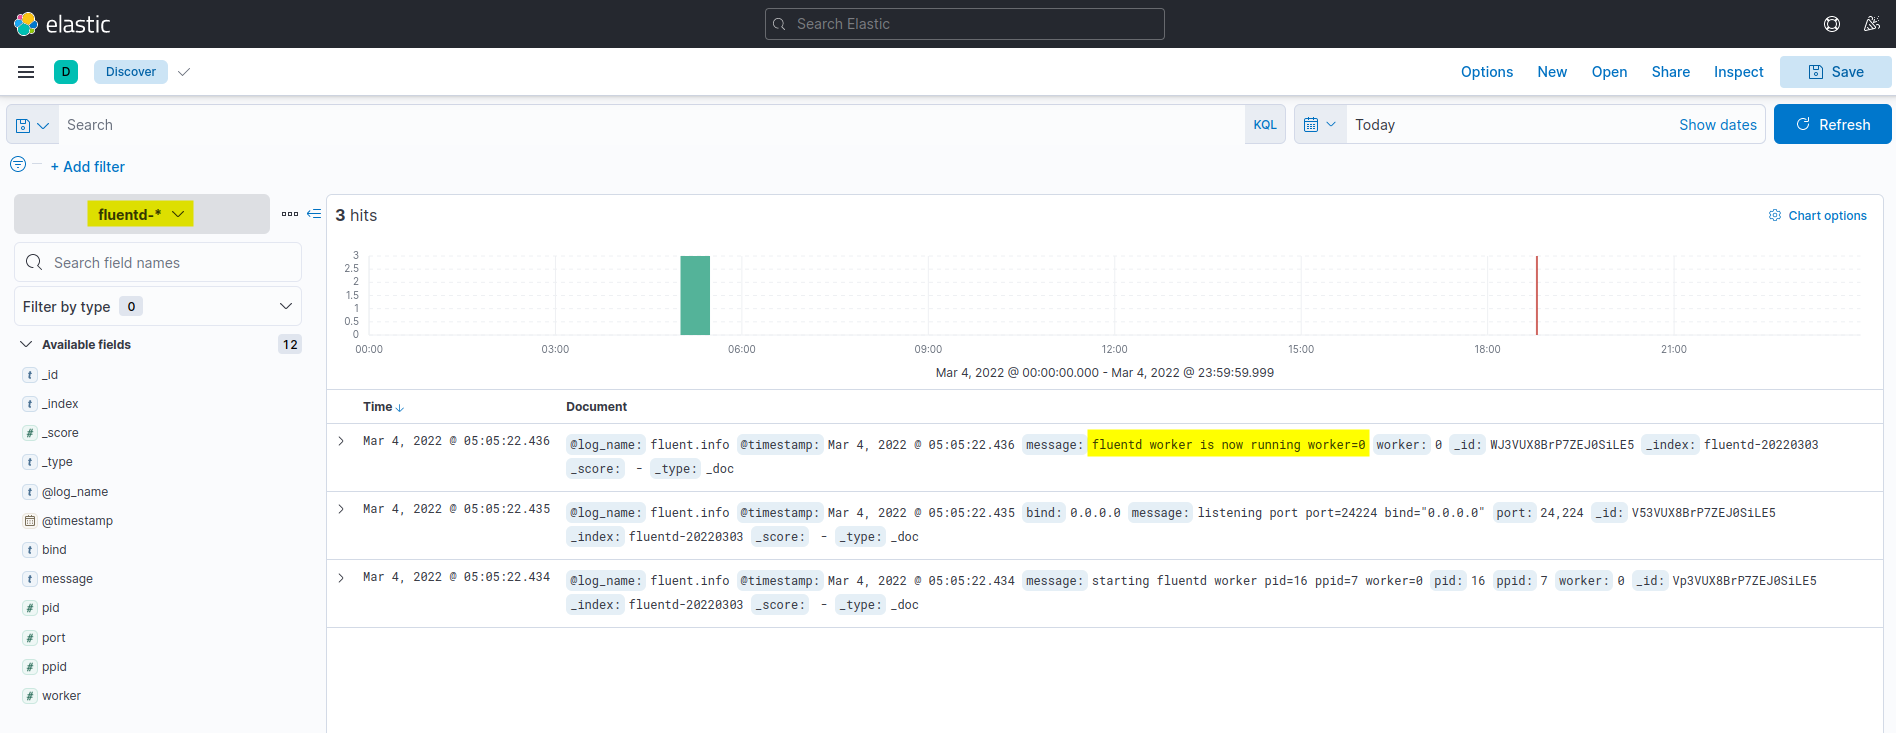
6. Cuối cùng, bên gốc trái chọn vào Discover để hiển thị logs

Accessing the Logs Monitoring

Kết quả sẽ trông như sau:

Showing Kibana Dashboard for Log Monitoring

Thực thi Docker Container với Fluentd Log Driver

Sau khi đã cấu hình xong Kibana, chúng ta sẽ bắt đầu chạy một docker container với Fluentd log drive để tự động gửi logs về EFK.

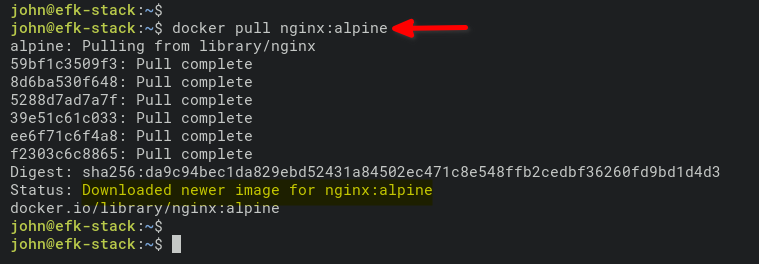
1. Kéo về images nginx

docker pull nginx:alpine
Downloading nginx:alpine Docker Image

2. Thực thi docker

Câu lệnh thực thi docker kèm theo tùy chọn–log-driver=fluentd , và expose port 8080 ra ngoài.

docker run --name nginx_container -d --log-driver=fluentd -p 8080:80 nginx:alpine
Running a New Container (nginx_container)

3. Kiểm tra lại trạng thái docker

docker ps
image 114
Running nginx_container and checking list containers

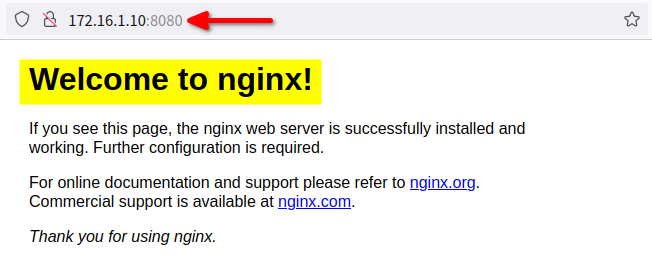
4. Truy cập vào nginx_container  và sinh ra logs access.

curl localhost:8080
Accessing nginx_container

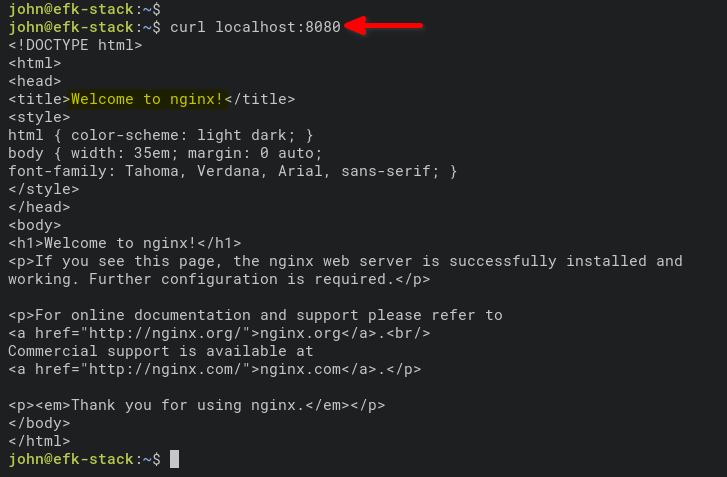
Hoặc bạn có thể truy cập trực tiếp bằng trình duyệt bất kỳ, ví dụ: http://172.168.1.10:8080

Accessing nginx_container via a Web Browser

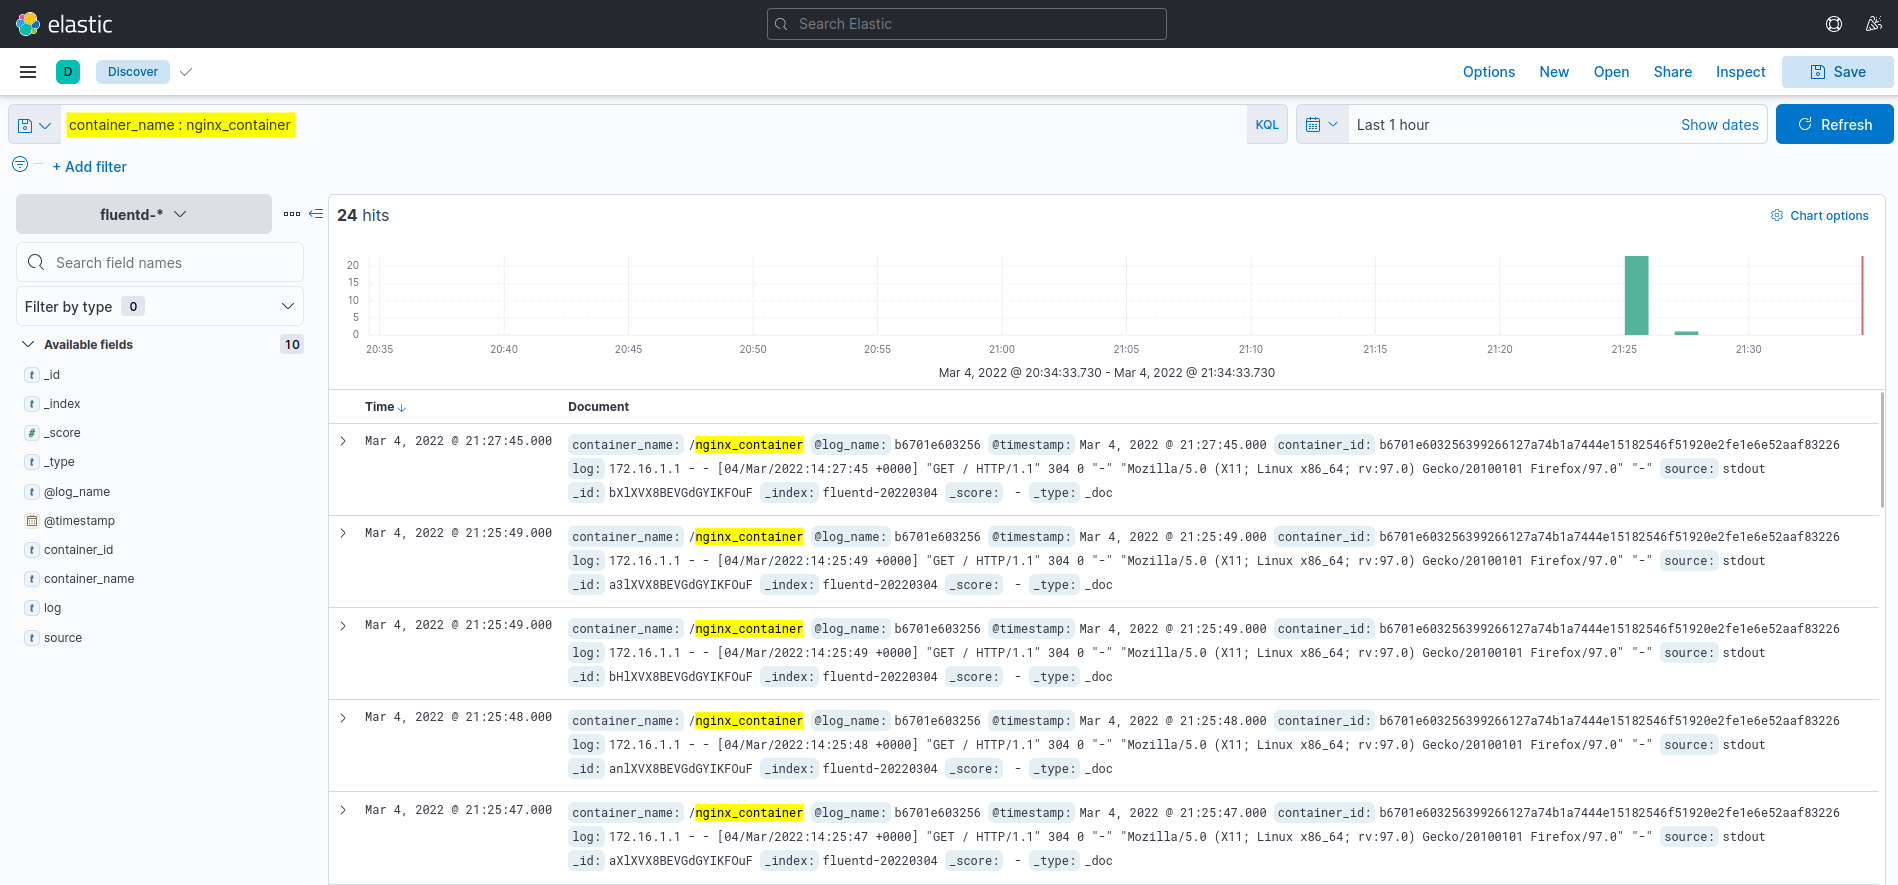
5. Kiểm tra lại logs trên Kibana Dashboard

Lúc này, ta sẽ thấy được logs truy cập được sinh ra từ container nginx_container trên Dashboard Kibana.

Showing logs of the nginx_container in the Kibana dashboard

Kết Bài

Chúng ta vừa trãi qua các bước để có thể triển khai được EFK ( (Elasticsearch, Fluentd, và Kibana) dùng cho việc giám sát và phân tích logs bằng Docker. Cũng như giúp bạn hiểu cách thiết lập và thu thập logs với Fluentd log driver để gửi về trung tâm quản lý logs EFK. Chúc bạn thiết lập thành công !

        Nguồn:                                     Truy Cập Diễn Đàn Ngay

congdonglinux.com                            forum.congdonglinux.com

   [maxbutton id=”2″ ]                            [maxbutton id=”3″ ] 

Đăng ký liền tay Nhận Ngay Bài Mới

Subscribe ngay

Cám ơn bạn đã đăng ký !

Lỗi đăng ký !

Add Comment

Click here to post a comment

Đăng ký liền tay
Nhận Ngay Bài Mới

Subscribe ngay

Cám ơn bạn đã đăng ký !

Lỗi đăng ký !