


How to Install and Monitor Services using Netdata Monitoring Tool on Debian 12
Netdata is an open-source monitoring system for Linux-based operating systems. It provides real-time performance and monitoring using beautiful and detailed dashboards. It offers hundreds of tools to monitor servers, CPU, memory usage, system processes, disk usage, IPv4 and IPv6 networks, system firewall, and applications like Nginx, MySQL, MongoDB, Redis, ElasticSearch, PostgreSQL, PHP-FPM, etc. It integrates with other monitoring tools such as Prometheus, Graphite, Kafka, Grafana, and more.
This tutorial will show you how to install and monitor various services using Netdata on a Debian 12 server. You will also use it to track the metrics of a LEMP stack and Docker engine.
Prerequisites
-
A server running Debian 12.
-
A non-root user with sudo privileges.
-
A Fully Qualified Domain Name (FQDN) like
netdata.example.compointing to your server. -
An SMTP account with an email service like Amazon SES or Mailgun.
-
Make sure everything is updated.
$ sudo apt update

$ sudo apt upgrade
-
Few packages that your system needs.
$ sudo apt install wget curl nano ufw software-properties-common dirmngr apt-transport-https gnupg2 ca-certificates lsb-release debian-archive-keyring unzip -y
Some of these packages may already be installed on your system.
Step 1 – Configure Firewall
The first step is to configure the firewall. Debian comes with ufw (Uncomplicated Firewall) by default.
Check if the firewall is running.
$ sudo ufw status
You will get the following output.
Status: inactive
Allow SSH port so that the firewall doesn’t break the current connection upon enabling it.
$ sudo ufw allow OpenSSH
Allow HTTP and HTTPS ports as well.
$ sudo ufw allow http

$ sudo ufw allow https
Enable the Firewall
$ sudo ufw enable

Command may disrupt existing ssh connections. Proceed with operation (y|n)? y

Firewall is active and enabled on system startup
Check the status of the firewall again.
$ sudo ufw status
You should see a similar output.
Status: active
To Action From
-- ------ ----
OpenSSH ALLOW Anywhere
80/tcp ALLOW Anywhere
443 ALLOW Anywhere
OpenSSH (v6) ALLOW Anywhere (v6)
80/tcp (v6) ALLOW Anywhere (v6)
443 (v6) ALLOW Anywhere (v6)
Step 2 – Install NetData
Netdata comes with an installer script that can work on any Linux distribution. Run the following command to download the installer script.
$ wget -O /tmp/netdata-kickstart.sh https://my-netdata.io/kickstart.sh
Run the installer script using the following command.
$ sudo sh /tmp/netdata-kickstart.sh --stable-channel --disable-telemetry
The --stable-channel flag installs the stable version of Netdata. The --disable-telemetry flag stops Netdata from submitting anonymous statistics back to their server. There are other flags you can use to customise your installer.
Enter Y to confirm adding the Netdata repository and installing it on your server. You should receive the following output on successful installation.
Successfully installed the Netdata Agent.
Official documentation can be found online at https://learn.netdata.cloud/docs/.
Looking to monitor all of your infrastructure with Netdata? Check out Netdata Cloud at https://app.netdata.cloud.
Join our community and connect with us on:
- GitHub: https://github.com/netdata/netdata/discussions
- Discord: https://discord.gg/5ygS846fR6
- Our community forums: https://community.netdata.cloud/
[/root]# rm -rf /tmp/netdata-kickstart-wH4pebXveT
OK
Netdata installer automatically enables and starts the service. Check the status of the service.
$ sudo systemctl status netdata

? netdata.service - Real time performance monitoring

     Loaded: loaded (/lib/systemd/system/netdata.service; enabled; preset: enabled)

     Active: active (running) since Thu 2023-08-24 10:26:56 UTC; 42s ago

   Main PID: 2811 (netdata)

      Tasks: 82 (limit: 1107)

     Memory: 108.2M

        CPU: 4.271s

     CGroup: /system.slice/netdata.service

             ??2811 /usr/sbin/netdata -D -P /var/run/netdata/netdata.pid

             ??2822 /usr/sbin/netdata --special-spawn-server

             ??3127 bash /usr/libexec/netdata/plugins.d/tc-qos-helper.sh 1

             ??3137 /usr/libexec/netdata/plugins.d/go.d.plugin 1

             ??3142 /usr/libexec/netdata/plugins.d/ebpf.plugin 1

             ??3145 /usr/libexec/netdata/plugins.d/nfacct.plugin 1

             ??3149 /usr/libexec/netdata/plugins.d/systemd-journal.plugin 1

             ??3155 /usr/libexec/netdata/plugins.d/debugfs.plugin 1

             ??3159 /usr/libexec/netdata/plugins.d/apps.plugin 1
Aug 24 10:26:58 netdata ebpf.plugin[3142]: set name of thread 3188 to EBPF SOFTIRQ
.......
If your service is not started or enabled, you can do so using the following command.
$ sudo systemctl enable netdata --now
Run the following command to check the open ports and the process using them.
$ sudo ss -plnt | grep netdata
You should get a similar output. Netdata uses port 19999 for its dashboard, as seen in the output below. Netdata uses port 8125 to receive statistics from other applications.
State  Recv-Q Send-Q      Local Address:Port  Peer Address:Port    Process

LISTEN 0      4096         0.0.0.0:19999      0.0.0.0:*            users:(("netdata",pid=2811,fd=8))

LISTEN 0      4096       127.0.0.1:8125       0.0.0.0:*            users:(("netdata",pid=2811,fd=47))

LISTEN 0      4096           [::1]:8125          [::]:*            users:(("netdata",pid=2811,fd=46))

LISTEN 0      4096            [::]:19999         [::]:*            users:(("netdata",pid=2811,fd=9))
Step 3 – Install Nginx
Debian 12 ships with an older version of Nginx. To install the latest version, you need to download the official Nginx repository.
Import Nginx’s signing key.
$ curl https://nginx.org/keys/nginx_signing.key | gpg --dearmor

    | sudo tee /usr/share/keyrings/nginx-archive-keyring.gpg >/dev/null
Add the repository for Nginx’s stable version.
$ echo "deb [signed-by=/usr/share/keyrings/nginx-archive-keyring.gpg]
http://nginx.org/packages/debian `lsb_release -cs` nginx"

    | sudo tee /etc/apt/sources.list.d/nginx.list
Update the system repositories.
$ sudo apt update
Install Nginx and Apache utilities. Apache utilities package is required for the htpasswd utility.
$ sudo apt install nginx apache2-utils
Verify the installation. On Debian systems, the following command will only work with sudo.
$ sudo nginx -v

nginx version: nginx/1.24.0
Start the Nginx server.
$ sudo systemctl start nginx
Check the service status.
$ sudo systemctl status nginx

? nginx.service - nginx - high performance web server

     Loaded: loaded (/lib/systemd/system/nginx.service; enabled; preset: enabled)

     Active: active (running) since Thu 2023-08-24 11:36:34 UTC; 4s ago

       Docs: https://nginx.org/en/docs/

    Process: 3657 ExecStart=/usr/sbin/nginx -c /etc/nginx/nginx.conf (code=exited, status=0/SUCCESS)

   Main PID: 3658 (nginx)

      Tasks: 2 (limit: 1107)

     Memory: 1.8M

        CPU: 12ms

     CGroup: /system.slice/nginx.service

             ??3658 "nginx: master process /usr/sbin/nginx -c /etc/nginx/nginx.conf"

             ??3659 "nginx: worker process"
Step 4 – Install SSL
We need to install Certbot to generate the SSL certificate. You can either install Certbot using Debian’s repository or grab the latest version using the Snapd tool. We will be using the Snapd version.
Debian 12 comes doesn’t come with Snapd installed. Install Snapd package.
$ sudo apt install snapd
Run the following commands to ensure that your version of Snapd is up to date.
$ sudo snap install core && sudo snap refresh core
Install Certbot.
$ sudo snap install --classic certbot
Use the following command to ensure that the Certbot command can be run by creating a symbolic link to the /usr/bin directory.
$ sudo ln -s /snap/bin/certbot /usr/bin/certbot
Verify if Certbot is functioning properly.
$ certbot --version

certbot 2.6.0
Generate the SSL certificate.
$ sudo certbot certonly --nginx --agree-tos --no-eff-email --staple-ocsp --preferred-challenges http -m [email protected] -d netdata.example.com
The above command will download a certificate to the /etc/letsencrypt/live/netdata.example.com directory on your server.
Generate a Diffie-Hellman group certificate.
$ sudo openssl dhparam -dsaparam -out /etc/ssl/certs/dhparam.pem 4096
Check the Certbot renewal scheduler service.
$ sudo systemctl list-timers
You will find snap.certbot.renew.service as one of the services scheduled to run.
NEXT                        LEFT          LAST                        PASSED      UNIT                         ACTIVATES

.....

Thu 2023-08-24 13:40:00 UTC 1h 59min left -                           -           snap.certbot.renew.timer     snap.certbot.renew.service

Thu 2023-08-24 18:47:23 UTC 7h left       Thu 2023-08-24 09:30:41 UTC 2h 9min ago apt-daily.timer              apt-daily.service

Fri 2023-08-25 00:00:00 UTC 12h left      -                           -           dpkg-db-backup.timer         dpkg-db-backup.service
Do a dry run of the process to check whether the SSL renewal is working fine.
$ sudo certbot renew --dry-run
If you see no errors, you are all set. Your certificate will renew automatically.
Step 5 – Configure Nginx
Create and open the file /etc/nginx/conf.d/netdata.conf for editing.
$ sudo nano /etc/nginx/conf.d/netdata.conf
Paste the following code in it.
# Define netdata upstream

upstream netdata {

    server 127.0.0.1:19999;

    keepalive 64;

}
# Redirect all non-encrypted to encrypted
server {
listen 80;
listen [::]:80;
server_name netdata.example.com;
return 301 https://netdata.example.com$request_uri;
}
server {
listen 443 ssl http2;
listen [::]:443 ssl http2;
server_name netdata.example.com;
ssl_certificate /etc/letsencrypt/live/netdata.example.com/fullchain.pem;
ssl_certificate_key /etc/letsencrypt/live/netdata.example.com/privkey.pem;
ssl_trusted_certificate /etc/letsencrypt/live/netdata.example.com/chain.pem;
ssl_session_timeout 1d;
ssl_session_cache shared:MozSSL:10m;
ssl_session_tickets off;
ssl_prefer_server_ciphers off;
ssl_stapling on;
ssl_stapling_verify on;
ssl_dhparam /etc/ssl/certs/dhparam.pem;
resolver 1.1.1.1 1.0.0.1 [2606:4700:4700::1111] [2606:4700:4700::1001] 8.8.8.8 8.8.4.4 [2001:4860:4860::8888] [2001:4860:4860::8844] valid=60s;
resolver_timeout 2s;
ssl_protocols TLSv1.2 TLSv1.3;
ssl_ciphers ECDHE-ECDSA-AES128-GCM-SHA256:ECDHE-RSA-AES128-GCM-SHA256:ECDHE-ECDSA-AES256-GCM-SHA384:ECDHE-RSA-AES256-GCM-SHA384:ECDHE-ECDSA-CHACHA20-POLY1305:ECDHE-RSA-CHACHA20-POLY1305:DHE-RSA-AES128-GCM-SHA256:DHE-RSA-AES256-GCM-SHA384;
access_log /var/log/nginx/netdata.example.com.access.log main;
error_log /var/log/nginx/netdata.example.com.error.log;
location / {
proxy_set_header X-Forwarded-For $proxy_add_x_forwarded_for;
proxy_set_header X-Forwarded-Host $host;
proxy_set_header X-Forwarded-Server $host;
proxy_pass http://netdata;
proxy_http_version 1.1;
proxy_pass_request_headers on;
proxy_set_header Connection "keep-alive";
proxy_store off;
auth_basic "NetData Private Area";
auth_basic_user_file /etc/nginx/.htpasswd;
}
}
Once finished, save the file by pressing Ctrl + X and entering Y when prompted.
Open the file /etc/nginx/nginx.conf for editing.
$ sudo nano /etc/nginx/nginx.conf
Add the following line before the line include /etc/nginx/conf.d/*.conf;.
server_names_hash_bucket_size 64;
Save the file by pressing Ctrl + X and entering Y when prompted.
Run the following command to generate a password file to enable HTTP authentication.
$ sudo htpasswd -c /etc/nginx/.htpasswd netadmin

New password:

Re-type new password:

Adding password for user netadmin
Verify the Nginx configuration file syntax.
$ sudo nginx -t

nginx: the configuration file /etc/nginx/nginx.conf syntax is ok

nginx: configuration file /etc/nginx/nginx.conf test is successful
Restart the Nginx service to enable the new configuration.
$ sudo systemctl restart nginx
Step 6 – Access and Use Netdata Dashboard
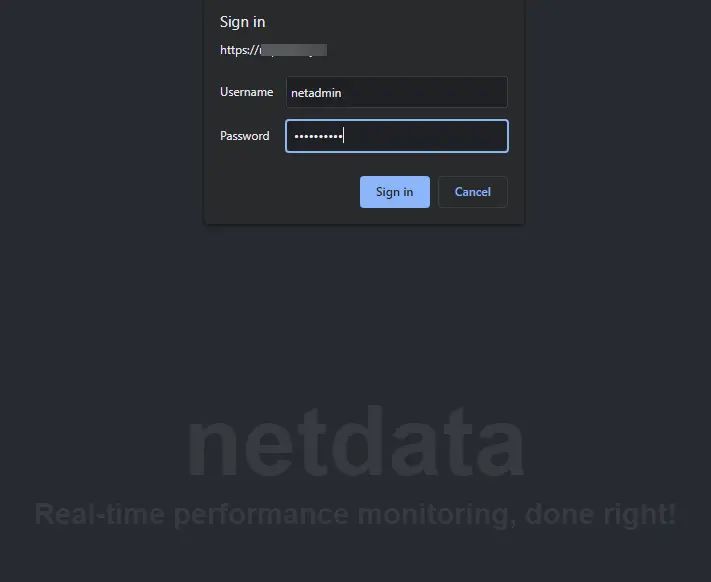
You should be able to access Netdata via the URL https://netdata.example.com. The first time you access it, you will be prompted for your HTTP authentication details.
You will get the following dashboard.
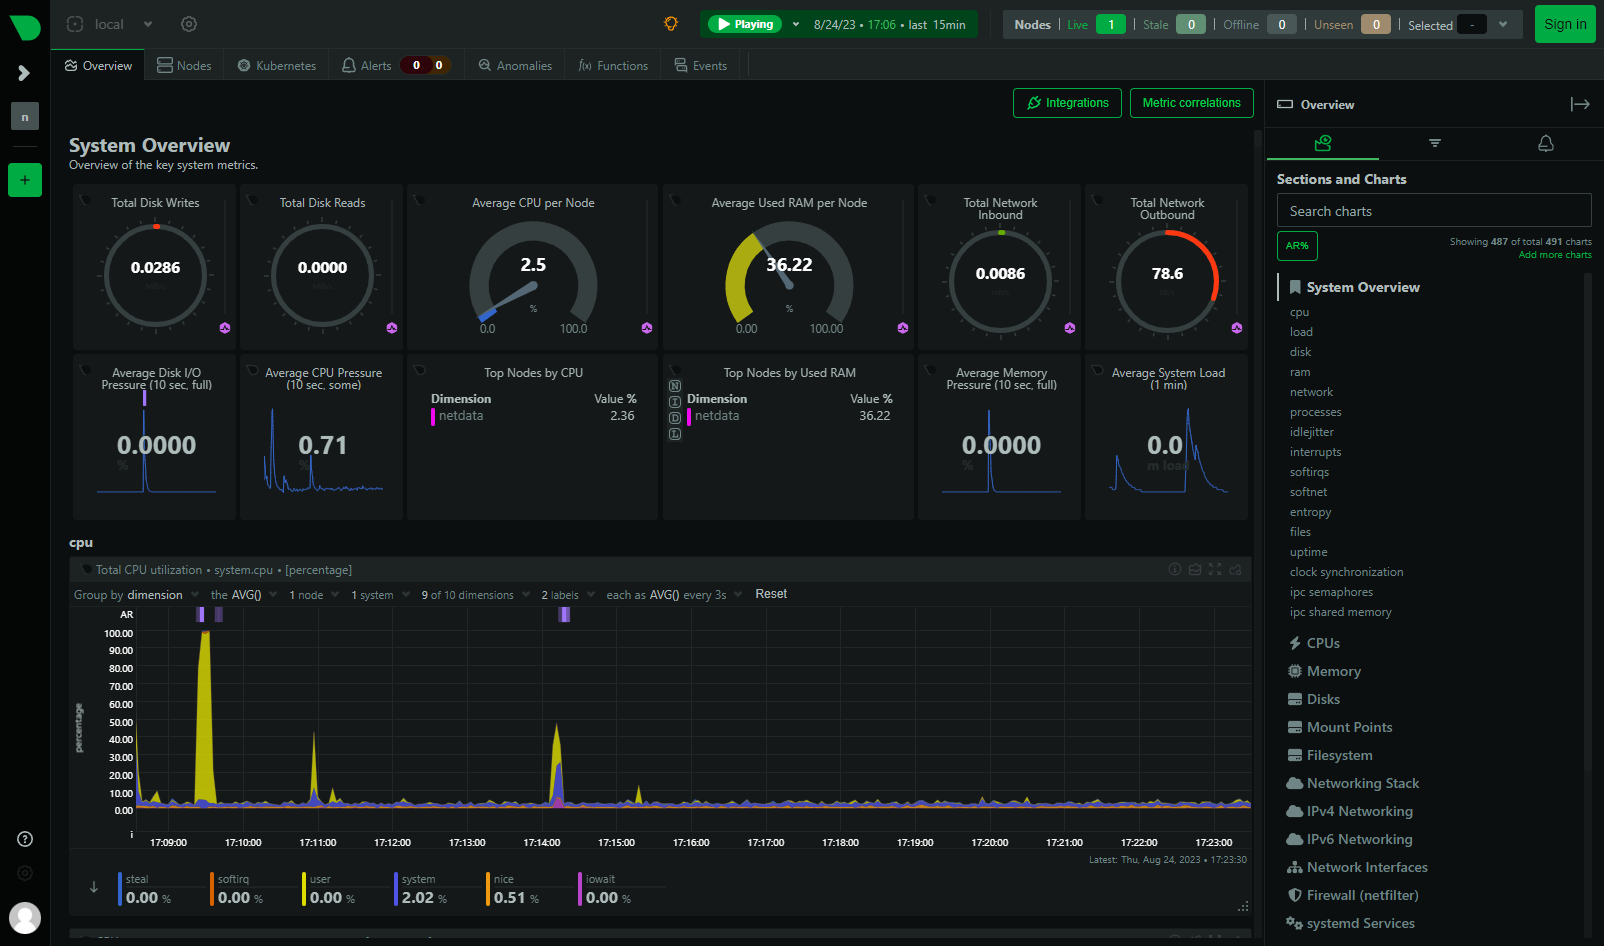
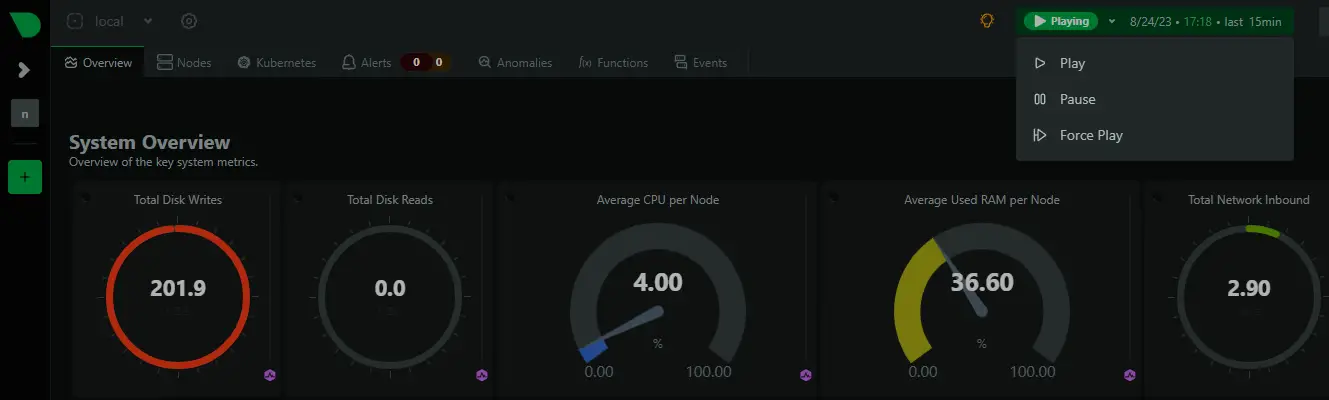
You can pause, stop, and start the monitoring anytime using the Play button on the dashboard.
You can access various dashboards by clicking on the options from the right sidebar.
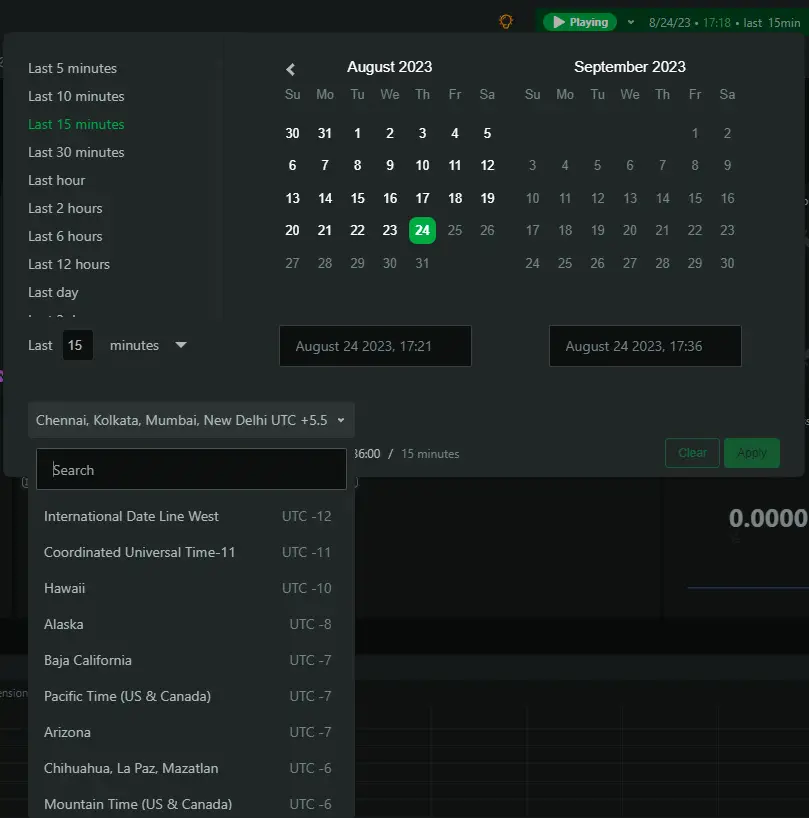
Netdata by default can track your timezone correctly. If it doesn’t then click the timer and select the correct timezone on the popup to change it.
Step 7 – Configure NetData
Netdata stores its main configuration in the /etc/netdata/netdata.conf file. You can view these settings by visiting the URL https://netdata.example.com/netdata.conf in your browser.
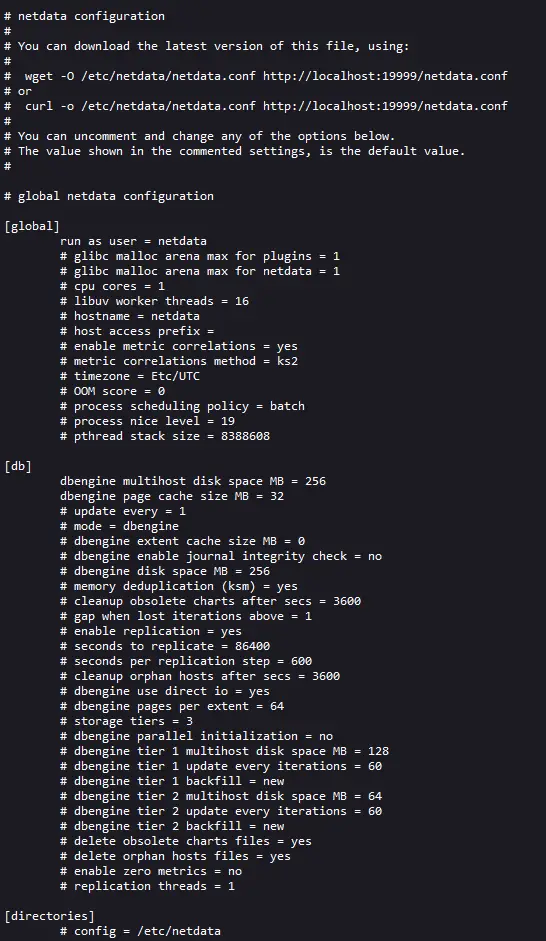
The file is divided into various sections, such as [global], [db], [web], [registry], and more. The default configuration is enough to get us started. Netdata collects data using two types of plugins:
- internal plugins are written in C language and run as threads inside the
netdatadaemon. - external plugins are written in various languages, including Python, Go, etc., and are spawned as long-running independent processes by the
netdatadaemon. They communicate with the Netdata daemon usingpipes.
Configure NetData Memory Usage
NetData’s RAM usage is decided based on the time you want to keep the recorded chart data before it gets lost.
- 3600 seconds or 1 hour of chart data retention uses 15 MB of RAM.
- 7200 seconds or 2 hours of chart data retention uses 30 MB of RAM.
- 14400 seconds or 4 hours of chart data retention uses 60 MB of RAM.
Every time you double the chart data retention time, the RAM requirement also doubles. These RAM requirements are based on the number of charts in use by the stock dashboard. Adding more charts and applications will change these estimates.
Open the Netdata configuration file.
$ sudo nano /etc/netdata/netdata.conf
Enter the line history = 14400 under the [global] section.
[global]
    run as user = netdata
# default storage size - increase for longer data retention
page cache size = 32
dbengine multihost disk space = 256
history = 14400
Save the file by pressing Ctrl + X and entering Y when prompted.
Turn off Telemetry
By default, Netdata collects anonymous usage information using a product analytics platform, Posthog. Every time the Netdata daemon is started or stopped, Netdata uses the anonymous statistics script to collect the following system information and send it to itself.
- Netdata version
- OS name, version, id, id_like
- Kernel name, version, architecture
- Virtualization technology
- Containerization technology
- Additional information about Netdata client failures.
We turned off Telemetry during installation but if you didn’t, you can do it now. Create an empty file called .opt-out-from-anonymous-statistics in the Netdata directory.
$ sudo touch /etc/netdata/.opt-out-from-anonymous-statistics
Restart Netdata to enable the change.
$ sudo systemctl restart netdata
Long term storage
Netdata uses your system’s RAM and disk to store historical data by default. The default Netdata process collects around 2000 metrics per second, which means the default configuration will store about two days’ worth of metrics on the RAM and disk.
To store more metrics, you have the following two options:
- Configure Netdata to use more RAM and disk space
- Archive the metrics to an external database
We will only discuss the first option in this tutorial. For the second option, you should refer to Netdata’s official documentation.
Configure Netdata to use more RAM and disk space
Open the file /etc/netdata/netdata.conf for editing.
$ sudo nano /etc/netdata/netdata.conf
Configure the following lines under the [global] section.
[global]
...

    page cache size = 32

    dbengine multihost disk space = 256
Save the file by pressing Ctrl + X and entering Y when prompted.
The page cache size determines the amount of RAM used, and the dbengine multihost disk space variable determines the disk usage. By default, Netdata uses 32 MB of RAM and 256 MB of disk space. You can change either of the two values to your liking.
You can use Netdata’s Storage Metric calculator to decide how much RAM and disk space you need.
Reduce Collection Frequency
You can optimize Netdata’s performance by increasing the time between metrics collection. By default, Netdata collects metrics every second.
To change that, open the Netdata configuration file for editing.
$ sudo nano /etc/netdata/netdata.conf
Enter the following line under the [global] section. This increases the frequency to 5 seconds.
[global]
...

    update every = 5
Save the file by pressing Ctrl + X and entering Y when prompted.
Step 8 – Configure Slack Notifications
The first step is to create a Slack application and connect it to a specific channel in your workspace to configure Slack Notifications.
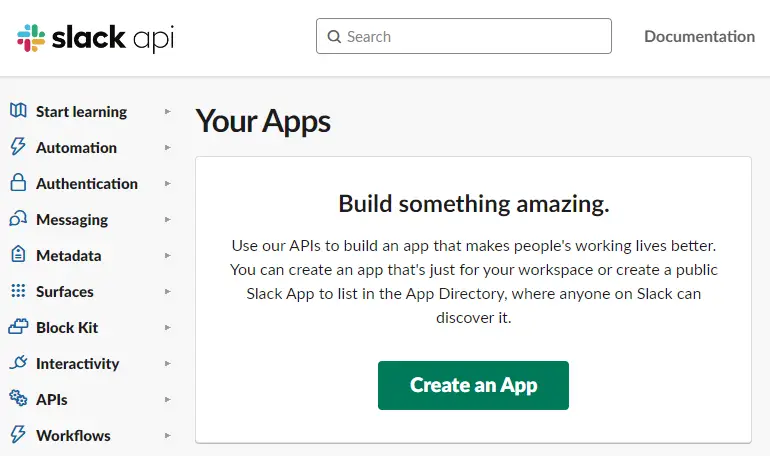
Visit the Slack API page and click on the Create App button to start creating an application.
Click on the From Scratch link to create the app.
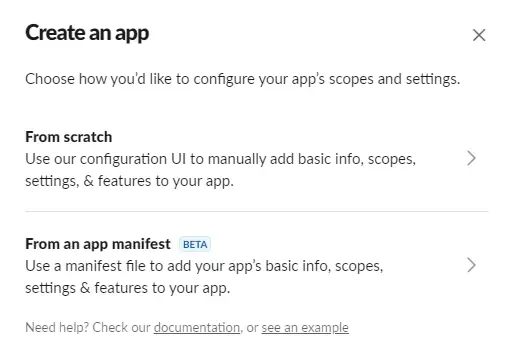
Select a name for your app and choose the workspace where you want your App to appear. If you don’t want to associate your app with the existing workspace, you can create another one and come back to this step.

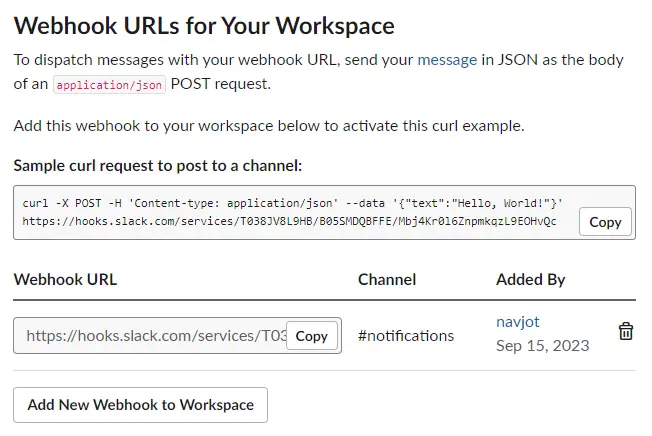
Open the Incoming Webhook page by selecting the option under the Features menu from the left sidebar, and then activate the webhook.
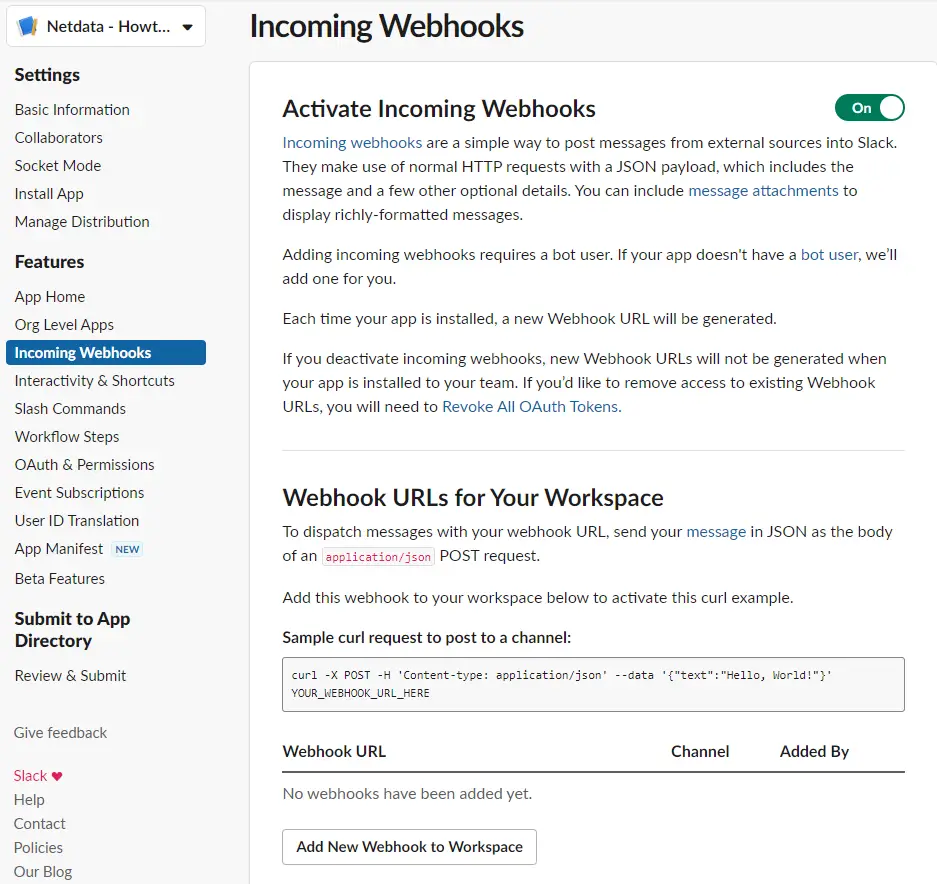
Click the Add New Webhook to Workspace button at the bottom of the page and select your workspace and the target channel for notifications.
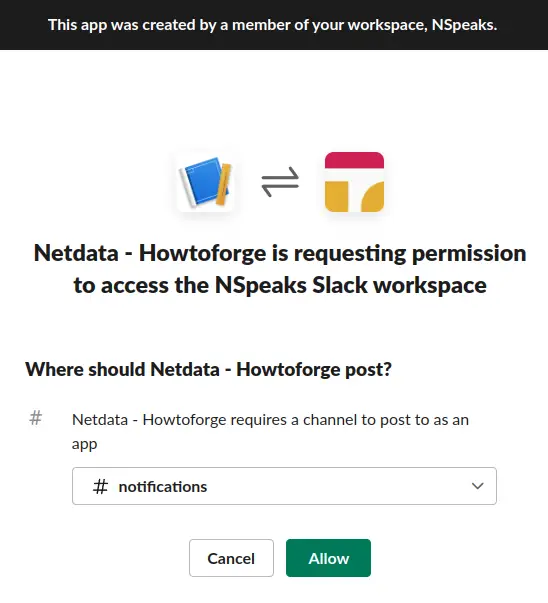
Click the Allow button to proceed. Return to the Incoming Webhooks page and copy the Webhook URL.
Return to the terminal and switch to the /etc/netdata directory.
$ cd /etc/netdata
Netdata provides a edit-config script to edit and create Netdata configuration files. Run the following file to create and open the file health_alarm_notify.conf using your system’s default editor.
$ sudo ./edit-config health_alarm_notify.conf
Scroll down to the following section.
# Enable slack notification

SEND_SLACK="YES"
# Select the slack webhook
SLACK_WEBHOOK_URL="https://hooks.slack.com/services/xxxxxxx/xxxxxx/xxxxxxxxxxxxx"
# Default channel for notification
DEFAULT_RECIPIENT_SLACK="notifications"
Ensure that the variable SEND_SLACK is set to yes. Paste the copied webhook URL to the SLACK_WEBHOOK_URL variable. Enter the name of your channel for the DEFAULT_RECIPIENT_SLACK variable.
If your editor is Vim, press the Escape key to exit editing, type 😡 and press the Enter key to save the file and exit the editor.
If your editor is Nano, save the file by pressing Ctrl + X and entering Y when prompted.
Restart Netdata to apply the changes.
$ sudo systemctl restart netdata
Step 9 – Configure Email Notifications
Netdata uses sendmail by default to send email notifications but managing an email server is not an easy task. Netdata doesn’t support SMTP, but you can install a package called msmtp client. It allows you to send mail to an SMTP server.
Install msmtp.
$ sudo apt install msmtp
Create and open the configuration file for msmtp.
$ sudo nano /etc/msmtprc
Paste the following code in it.
# Set default values for all following accounts.

defaults
# Use the mail submission port 587 instead of the SMTP port 25.
port 587
# Always use TLS.
tls on
# The SMTP server of your ISP
account ses
host email-smtp.<location>.amazonaws.com
from [email protected]
auth on
user <yoursesusername>
password <yoursespassword>
# Set default account to isp
account default: ses
Save the file by pressing Ctrl + X and entering Y when prompted.
Netdata provides a edit-config script to edit and create Netdata configuration files. Run the following file to create and open the file health_alarm_notify.conf using your system’s default editor.
$ sudo /etc/netdata/edit-config health_alarm_notify.conf
Scroll down to the following section and enter the path to the msmtp.
# external commands
# The full path to the sendmail command.
# If empty, the system $PATH will be searched for it.
# If not found, email notifications will be disabled (silently).
sendmail="/usr/bin/msmtp"
Locate the following section and enter the details of the sender and receiver and ensure that email sending is enabled.
# email global notification options
# multiple recipients can be given like this:
# "[email protected] [email protected] ..."
# the email address sending email notifications
# the default is the system user netdata runs as (usually: netdata)
# The following formats are supported:
# EMAIL_SENDER="user@domain"
# EMAIL_SENDER="User Name <user@domain>"
# EMAIL_SENDER="'User Name' <user@domain>"
# EMAIL_SENDER=""User Name" <user@domain>"
EMAIL_SENDER="Server Admin <[email protected]>"
# enable/disable sending emails
SEND_EMAIL="YES"
# if a role recipient is not configured, an email will be send to:
DEFAULT_RECIPIENT_EMAIL="[email protected]"
# to receive only critical alarms, set it to "root|critical"
Save the file by pressing Ctrl + X and entering Y when prompted.
Restart Netdata to apply the changes.
$ sudo systemctl restart netdata
Step 10 – Test Notification Channels
Let us test if the email notifications work. Log in as the system user netdata created during installation.
$ sudo su -s /bin/bash netdata
Run the Alarm notification script to send a test notification.
$ /usr/libexec/netdata/plugins.d/alarm-notify.sh test
You will receive the following output.
# SENDING TEST WARNING ALARM TO ROLE: sysadmin

2023-08-24 12:56:00: alarm-notify.sh: INFO: sent email notification for: netdata test.chart.test_alarm is WARNING to '[email protected]'

# OK
# SENDING TEST CRITICAL ALARM TO ROLE: sysadmin
2023-08-24 12:56:03: alarm-notify.sh: INFO: sent email notification for: netdata test.chart.test_alarm is CRITICAL to '[email protected]'
# OK
# SENDING TEST CLEAR ALARM TO ROLE: sysadmin
2023-08-24 12:56:06: alarm-notify.sh: INFO: sent email notification for: netdata test.chart.test_alarm is CLEAR to '[email protected]'
# OK
Exit the user.
$ exit.
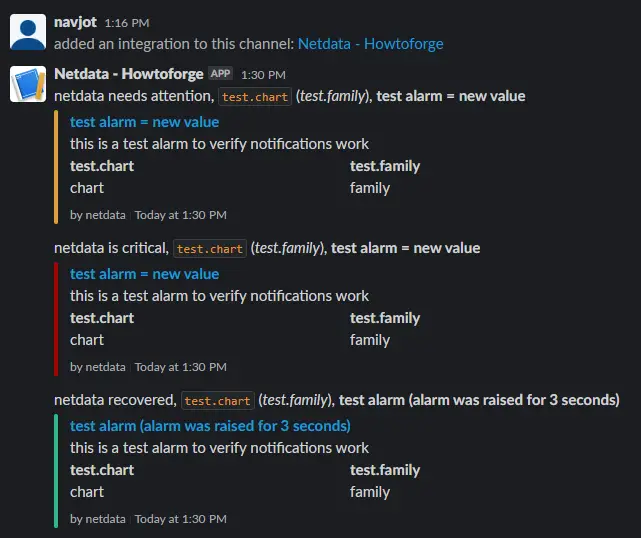
Open your Slack application, and you should have received the following alerts.
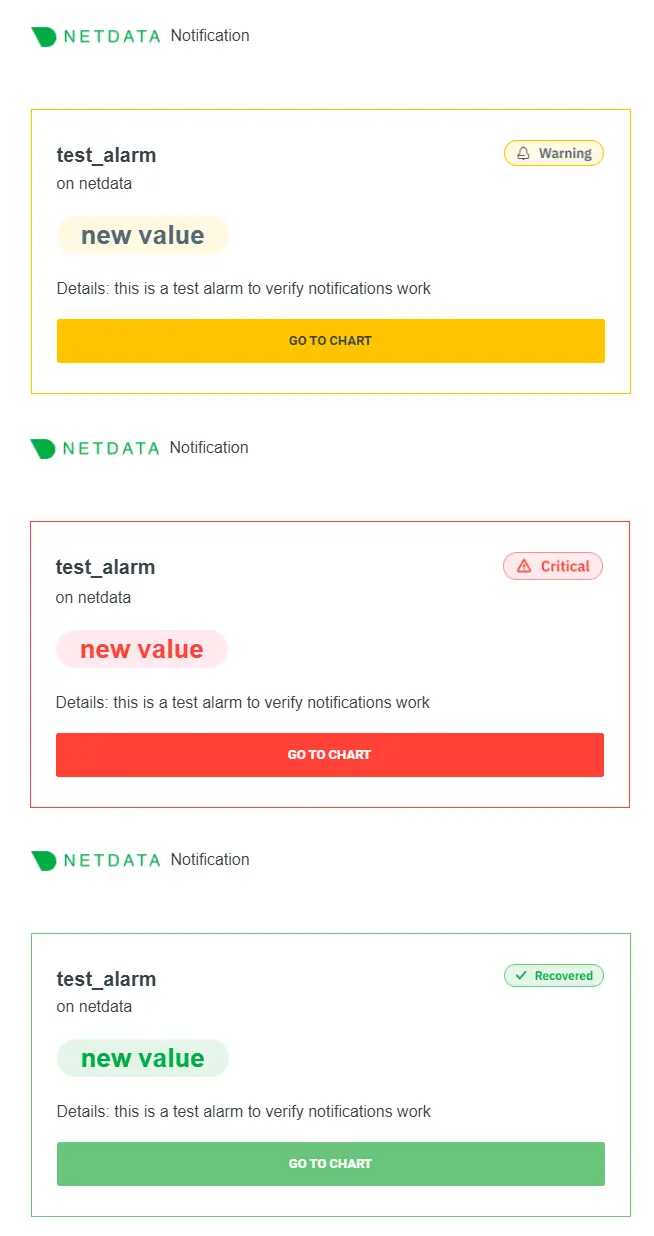
You should also get three emails about the test warnings.
Step 11 – Configure System Monitoring
Now that we have configured and tested notifications, let us configure and test notifications for the system, like CPU usage.
Run the following commands to create and open the CPU configuration file.
$ sudo /etc/netdata/edit-config health.d/cpu.conf
Change the values of the warn and crit options under the 10min_cpu_usage as shown below.
warn: $this > (($status >= $WARNING)  ? (60) : (70))

crit: $this > (($status == $CRITICAL) ? (75) : (85))
Change the line to:silent to to:sysadmin as shown.s
 template: 10min_cpu_usage

       on: system.cpu

    class: Utilization

     type: System

component: CPU

       os: linux

    hosts: *

   lookup: average -10m unaligned of user,system,softirq,irq,guest

    units: %

    every: 1m

     warn: $this > (($status >= $WARNING)  ? (60) : (70))

     crit: $this > (($status == $CRITICAL) ? (75) : (85))

    delay: down 15m multiplier 1.5 max 1h

     info: average CPU utilization over the last 10 minutes (excluding iowait, nice and steal)

       to: sysadmin
Save the file and exit the editor.
The setting to:silent silences the notifications and therefore to get the notifications, you need to change the value of the monitor to to:sysadmin for those monitors.
The above setting will send a warning if the CPU usage falls between 60 and 70% and a critical warning when the CPU usage falls between 75 and 85%.
Restart the Netdata service.
$ sudo systemctl restart netdata
Let us test the setting by installing the Stress application.
$ sudo apt install stress
Run the following command to spike the CPU usage of your server.
$ stress --cpu 2
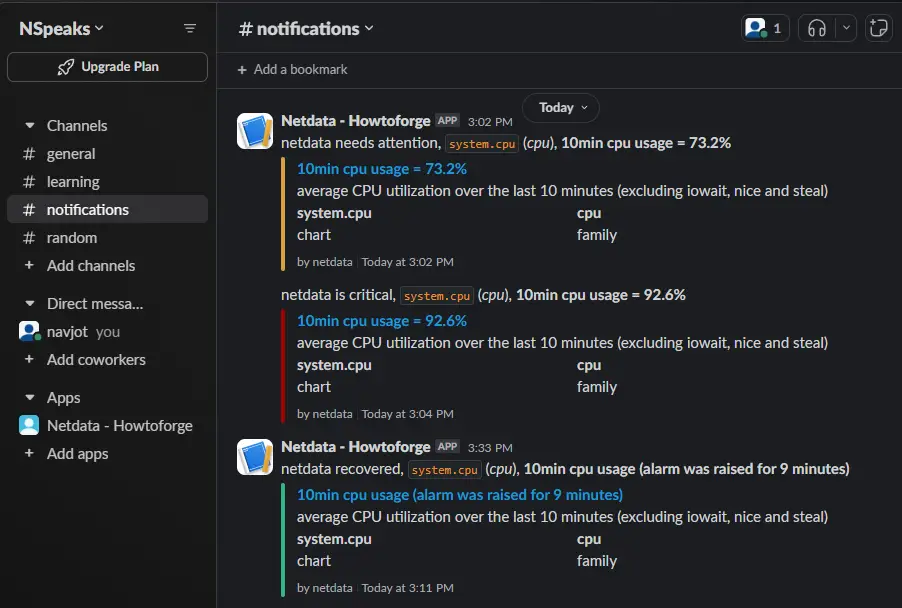
Leave the command running for 5-10 minutes, and you will receive High CPU usage messages. Once you receive those messages, return to the terminal and exit the command by pressing Ctrl + Z.
After stopping the service, you will receive a CPU recovery notification on Slack.
You will receive the following email messages for the same.
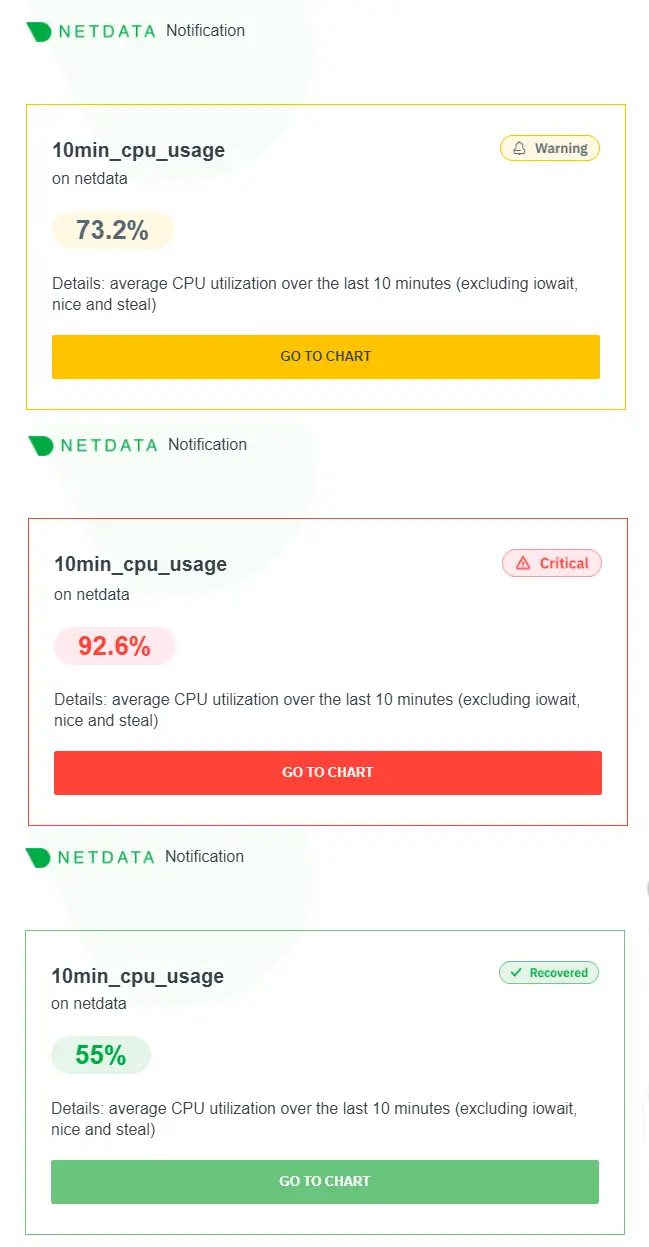
Step 12 – Configure Nginx Monitoring
One of the most commonly monitored apps using Netdata is the server and SQL packages. Let’s monitor the Nginx server using Netdata.
To enable the monitoring of the Nginx server, we need to use the ngx_http_stub_status_module. It usually comes pre-installed with Nginx. You can check if the module is present. The sudo is required on the command on the Debian system.
$ sudo nginx -V 2>&1 | grep -o with-http_stub_status_module

with-http_stub_status_module
If you get no response, it means your Nginx installation doesn’t support the feature. You will need to compile Nginx in that case.
Open the Nginx’s default configuration file /etc/nginx/conf.d/default.conf for editing. The file’s location is different because we installed Nginx from its official repository. If you are installing Nginx from the OS’s repository, then the location for the file will be /etc/nginx/nginx.conf.
$ sudo nano /etc/nginx/conf.d/default.conf
Enter the following code inside the server block before the last closing curly bracket.
# Enable module stub_status

location /stub_status {

	stub_status;

    allow 127.0.0.1;        #only allow requests from localhost

    deny all;               #deny all other hosts

}
Save the file by pressing Ctrl + X and entering Y when prompted.
Verify the Nginx configuration.
$ sudo nginx -t

nginx: the configuration file /etc/nginx/nginx.conf syntax is ok

nginx: configuration file /etc/nginx/nginx.conf test is successful
Restart the Nginx server.
$ sudo systemctl restart nginx
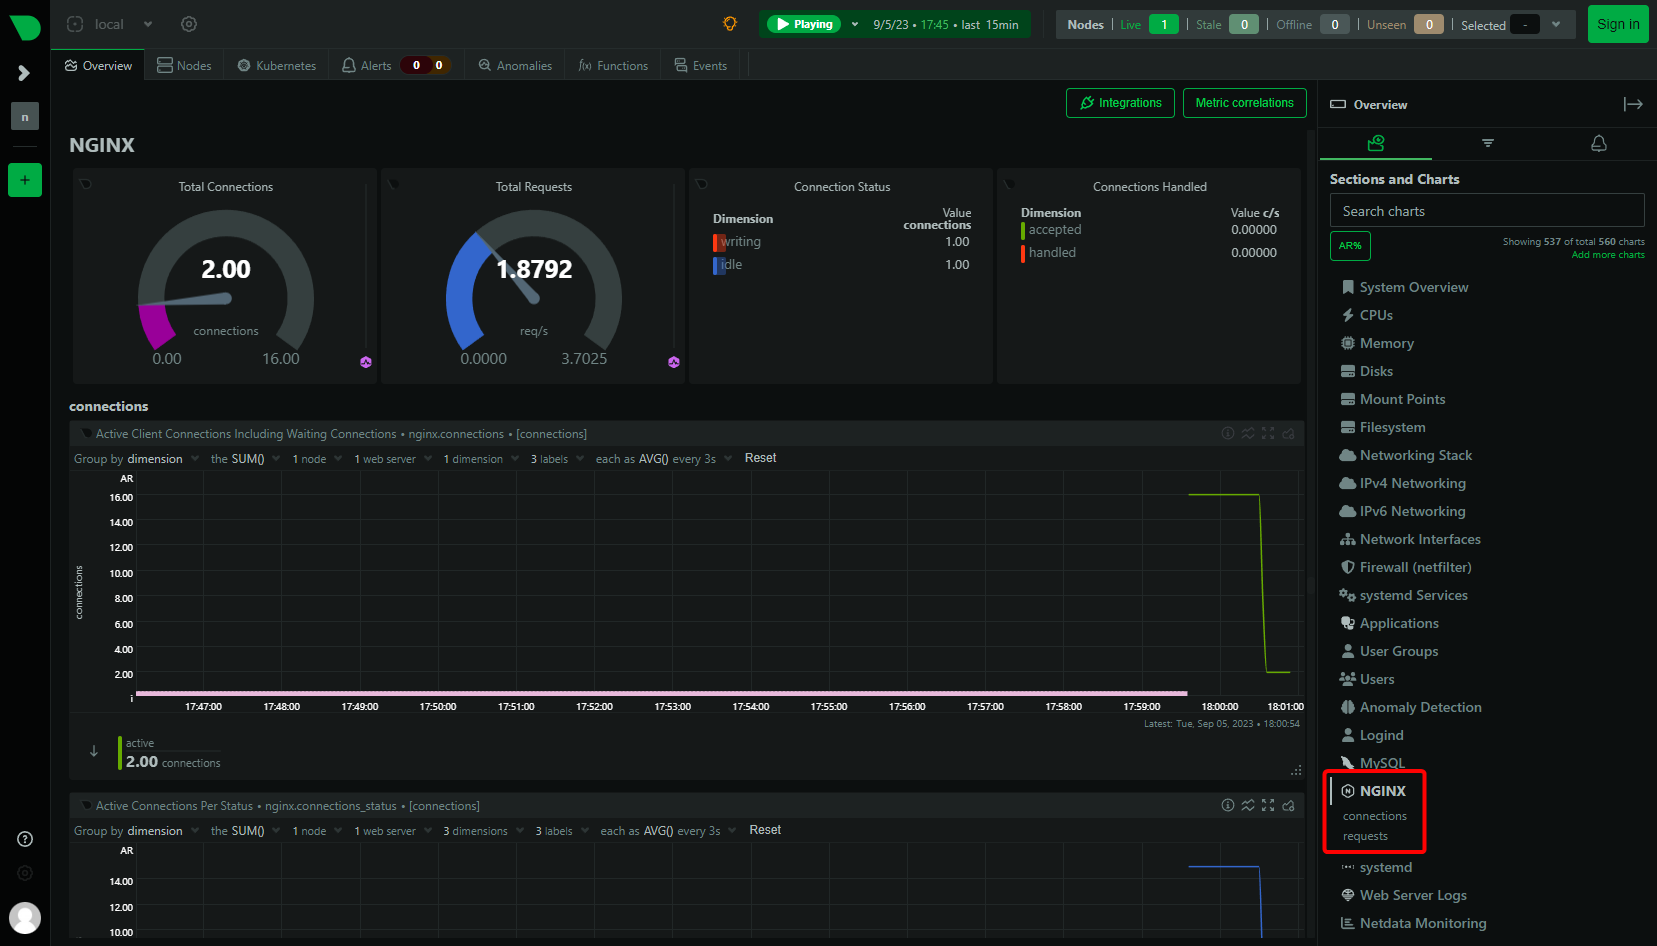
Restart the Netdata service.
$ sudo systemctl restart netdata
You should see Nginx connection details in your Netdata dashboard.
Monitor Nginx Logs
Netdata can also monitor Nginx access logs. To do that, switch to the Netdata directory.
$ cd /etc/netdata
Run the following command to generate a configuration file for monitoring Access Logs.
$ sudo ./edit-config go.d/web_log.conf
Scroll to the bottom of the file and find the following section.
# -------------------------------------------

# nginx log on various distros
# debian, arch
nginx_log:
name: 'nginx'
path: '/var/log/nginx/access.log'
# gentoo
nginx_log2:
name: 'nginx_site'
path: '/var/log/nginx/localhost.access_log'
Change the path to monitor respective log files. You can add as many sections to monitor as many hosts and their access log files. Our configuration file looks like the following.
# -------------------------------------------

# nginx log on various distros
# debian, arch
nginx_log:
name: 'nginx'
path: '/var/log/nginx/access.log'
nginx_log2:
name: 'nginx_site1'
path: '/var/log/nginx/site1.access_log'
nginx_log3:
name: 'nginx_site2'
path: '/var/log/nginx/site2.access_log'
nginx_log4:
name: 'nginx_site3'
path: '/var/log/nginx/site3.access_log'
Save and exit the editor.
To access the log files, Netdata needs permission to access the directory. By default, the adm system group has permission to access the log files. To give Netdata access, we need to add the netdata user to the adm group.
$ sudo usermod -aG adm netdata
Restart Nginx and the Netdata service.
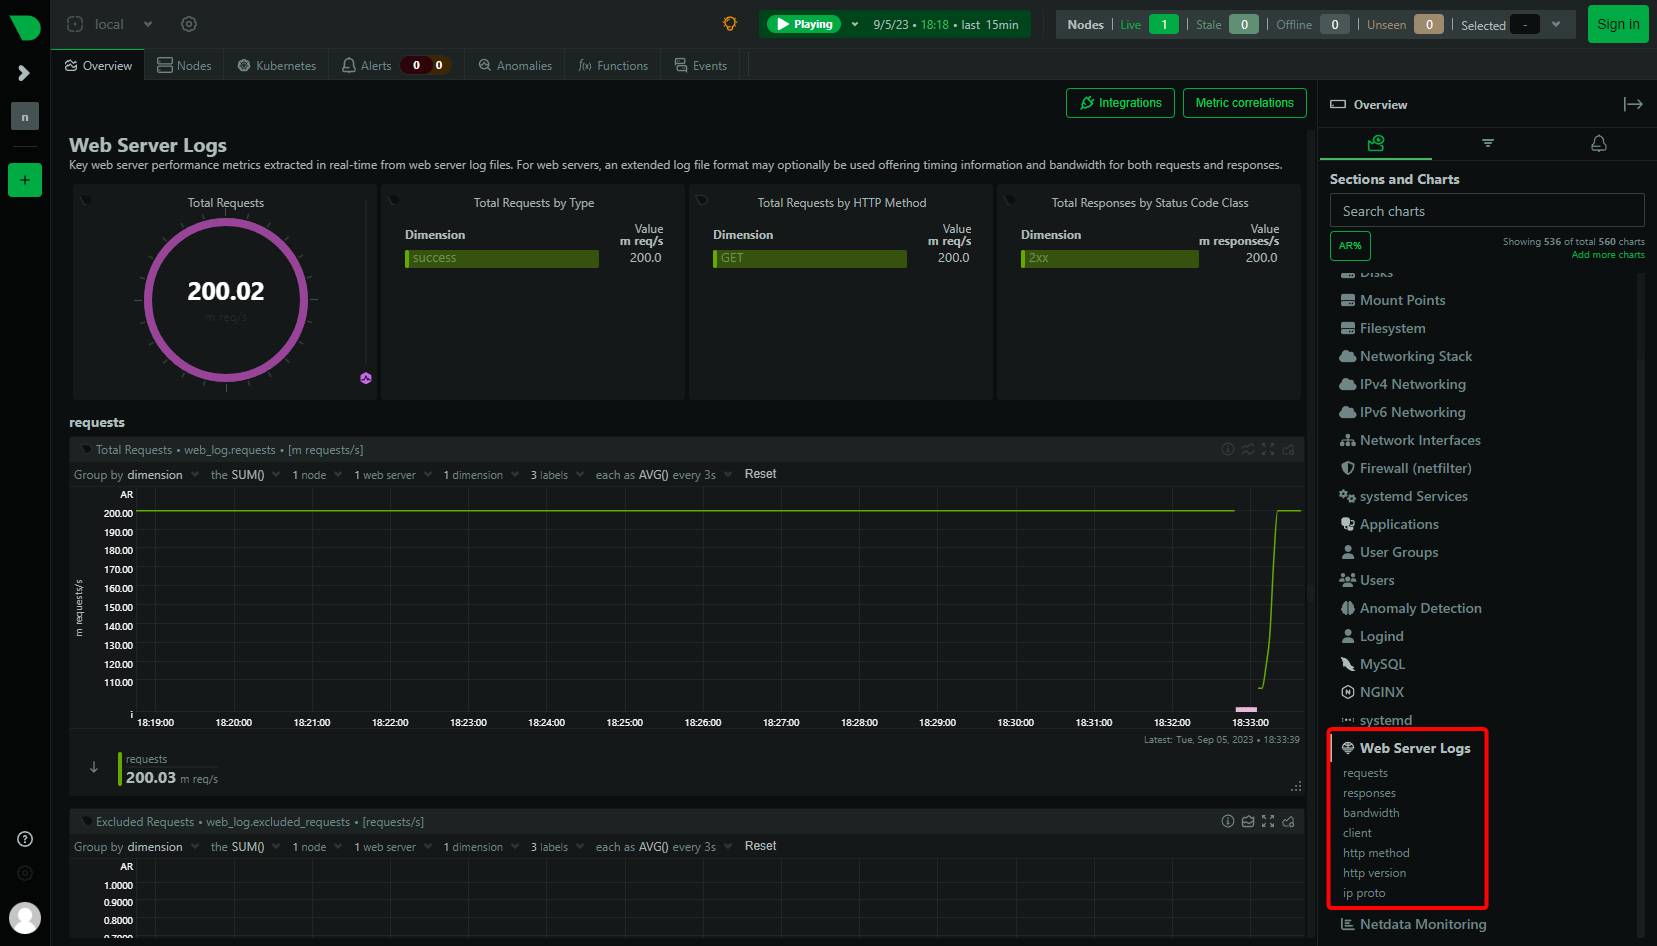
$ sudo systemctl restart nginx netdata
Reload the Netdata dashboard to view your log file data.
Step 13 – Configure MySQL/MariaDB Monitoring
We will install MariaDB for our tutorial. We will use the MariaDB repository for this purpose.
Import MariaDB GPG key.
$ sudo curl -o /usr/share/keyrings/mariadb-keyring.pgp 'https://mariadb.org/mariadb_release_signing_key.pgp'
Create and open the MariaDB repository file.
$ sudo nano /etc/apt/sources.list.d/mariadb.sources
Paste the following code in it.
# MariaDB 10.11 repository list - created 2023-09-05 11:18 UTC

# https://mariadb.org/download/

X-Repolib-Name: MariaDB

Types: deb

# deb.mariadb.org is a dynamic mirror if your preferred mirror goes offline. See https://mariadb.org/mirrorbits/ for details.

# URIs: https://deb.mariadb.org/10.11/debian

URIs: https://mirrors.aliyun.com/mariadb/repo/10.11/debian

Suites: bookworm

Components: main

Signed-By: /usr/share/keyrings/mariadb-keyring.pgp
Save the file by pressing Ctrl + X and entering Y when prompted.
Update the system repositories list.
$ sudo apt update
Install the MariaDB server.
$ sudo apt install mariadb-server
MariaDB is enabled and running. Check the service status.
$ sudo systemctl status mariadb

? mariadb.service - MariaDB 10.11.5 database server

     Loaded: loaded (/lib/systemd/system/mariadb.service; enabled; preset: enabled)

    Drop-In: /etc/systemd/system/mariadb.service.d

             ??migrated-from-my.cnf-settings.conf

     Active: active (running) since Tue 2023-09-05 11:44:17 UTC; 20s ago

       Docs: man:mariadbd(8)

             https://mariadb.com/kb/en/library/systemd/

    Process: 9396 ExecStartPre=/usr/bin/install -m 755 -o mysql -g root -d /var/run/mysqld (code=exited, status=0/SUCCESS)

    Process: 9397 ExecStartPre=/bin/sh -c systemctl unset-environment _WSREP_START_POSITION (code=exited, status=0/SUCCESS)

    Process: 9399 ExecStartPre=/bin/sh -c [ ! -e /usr/bin/galera_recovery ] && VAR= ||   VAR=`cd /usr/bin/..; /usr/bin/galera_recovery`; [ $? -eq 0 ]   && systemctl set-environment _WSREP_START_POSITION=$VAR >

    Process: 9440 ExecStartPost=/bin/sh -c systemctl unset-environment _WSREP_START_POSITION (code=exited, status=0/SUCCESS)

    Process: 9442 ExecStartPost=/etc/mysql/debian-start (code=exited, status=0/SUCCESS)

   Main PID: 9428 (mariadbd)

     Status: "Taking your SQL requests now..."

      Tasks: 13 (limit: 1107)

     Memory: 111.8M

        CPU: 663ms

     CGroup: /system.slice/mariadb.service

             ??9428 /usr/sbin/mariadbd
Start the MySQL secure installation script. The file name is different in the case of MariaDB.
$ sudo mariadb-secure-installation

....

Enter current password for root (enter for none): (Press Enter)

....

Switch to unix_socket authentication [Y/n] Y (Type Y and Press Enter)

....

Change the root password? [Y/n] Y (Type Y and Press Enter)

New password:

Re-enter new password:

Password updated successfully!

....

Remove anonymous users? [Y/n] Y (Type Y and Press Enter)

....

Disallow root login remotely? [Y/n] Y (Type Y and Press Enter)

....

Remove test database and access to it? [Y/n] Y (Type Y and Press Enter)

....

Reload privilege tables now? [Y/n] Y (Type Y and Press Enter)

....

All done!  If you've completed all of the above steps, your MariaDB

installation should now be secure.
Thanks for using MariaDB!
Open the /etc/mysql/mariadb.conf.d/50-server.cnf file for editing.
$ sudo nano /etc/mysql/mariadb.conf.d/50-server.cnf
Find the [mariadb] section in the file and paste the following line as shown below to enable the Userstats plugin. This setting works only on MariaDB and not on the MySQL server.
[mariadb]
userstat = 1
Log in to the MySQL shell.
$ sudo mysql
Run the following commands to create a Netdata SQL user and give it privileges to track MySQL stats.
MariaDB> create user 'netdata'@'localhost';

MariaDB> GRANT USAGE, REPLICATION CLIENT, PROCESS ON *.* TO 'netdata'@'localhost';

MariaDB> FLUSH PRIVILEGES;

MariaDB> exit
Create the MySQL configuration file for Netdata.
$ sudo /etc/netdata/edit-config go.d/mysql.conf
A file will open showing all the possible options. If you are satisfied, save and close the file by pressing Ctrl + X and entering Y when prompted.
Restart the MariaDB server.
$ sudo systemctl restart mariadb
Restart the Netdata service.
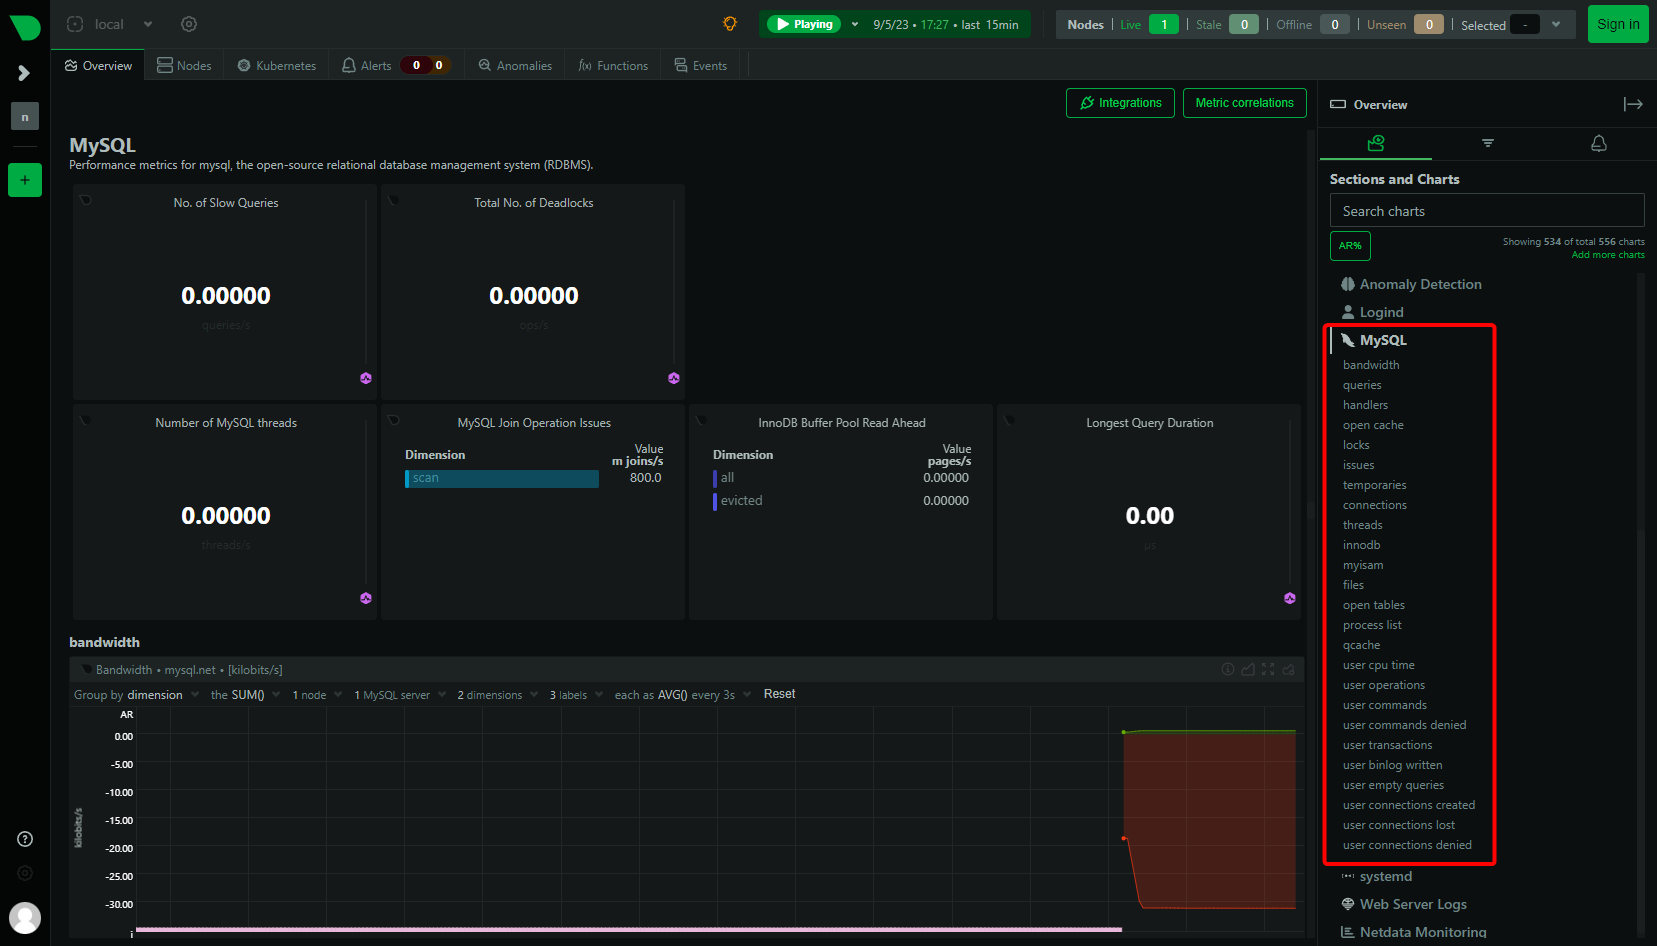
$ sudo systemctl restart netdata
The MariaDB/MySQL dashboard should start appearing in the Netdata dashboard.
Step 14 – Configure PHP-FPM Monitoring
You can monitor one or more PHP-FPM instances using Netdata. For our tutorial, we will install PHP 8.2 and then enable its monitoring.
Debian 12 ships with PHP 8.2 by default. But to always stay on the latest version of PHP we will use Ondrej’s PHP repository.
First, import Sury’s repo PHP GPG key.
$ sudo curl -sSLo /usr/share/keyrings/deb.sury.org-php.gpg https://packages.sury.org/php/apt.gpg
Add Ondrej Sury’s PHP repository.
$ sudo sh -c 'echo "deb [signed-by=/usr/share/keyrings/deb.sury.org-php.gpg] https://packages.sury.org/php/ $(lsb_release -sc) main" > /etc/apt/sources.list.d/php.list'
Update the system repository list.
$ sudo apt update
Now, you can install any version of PHP.
$ sudo apt install php8.2-fpm php8.2-cli php8.2-mbstring
Verify the installation.
$ php --version

PHP 8.2.10 (cli) (built: Sep  4 2023 08:12:29) (NTS)

Copyright (c) The PHP Group

Zend Engine v4.2.10, Copyright (c) Zend Technologies

    with Zend OPcache v8.2.10, Copyright (c), by Zend Technologies
Configure PHP
Open the file /etc/php/8.2/fpm/pool.d/www.conf.
$ sudo nano /etc/php/8.2/fpm/pool.d/www.conf
We need to set the Unix user/group of PHP processes to nginx. Find the user=www-data and group=www-data lines in the file and change them to nginx.
....

; Unix user/group of the child processes. This can be used only if the master

; process running user is root. It is set after the child process is created.

; The user and group can be specified either by their name or by their numeric

; IDs.

; Note: If the user is root, the executable needs to be started with

;       --allow-to-run-as-root option to work.

; Default Values: The user is set to master process running user by default.

;                 If the group is not set, the user's group is used.

user = nginx

group = nginx

....
Also, find the lines listen.owner=www-data and listen.group=www-data in the file and change them to nginx.
listen.owner = nginx

listen.group = nginx
Scroll down the file to locate the ;pm.status_path = /status option. Uncomment the line by removing the semi-colon in front of it, as shown below.
....

; Note: There is a real-time FPM status monitoring sample web page available

;       It's available in: /usr/share/php/8.2/fpm/status.html

;

; Note: The value must start with a leading slash (/). The value can be

;       anything, but it may not be a good idea to use the .php extension or it

;       may conflict with a real PHP file.

; Default Value: not set

pm.status_path = /status

....
Save the file by pressing Ctrl + X and entering Y when prompted.
Restart the PHP-fpm process.
$ sudo systemctl restart php8.2-fpm
Add PHP Settings to Nginx
Open the Nginx’s default configuration file /etc/nginx/conf.d/default.conf for editing.
$ sudo nano /etc/nginx/conf.d/default.conf
Enter the following code inside the server block before the last closing curly bracket.
# define PHP-FPM monitoring

location ~ ^/(status|ping)$ {

    allow 127.0.0.1;

    fastcgi_param SCRIPT_FILENAME $document_root$fastcgi_script_name;

    fastcgi_index index.php;

    include fastcgi_params;

    fastcgi_pass unix:/run/php/php8.2-fpm.sock; # Depends on the PHP Version and OS Distro

}
Save the file by pressing Ctrl + X and entering Y when prompted.
Verify the Nginx configuration.
$ sudo nginx -t

nginx: the configuration file /etc/nginx/nginx.conf syntax is ok

nginx: configuration file /etc/nginx/nginx.conf test is successful
Restart the Nginx server.
$ sudo systemctl restart nginx
Restart the Netdata service.
$ sudo systemctl restart netdata
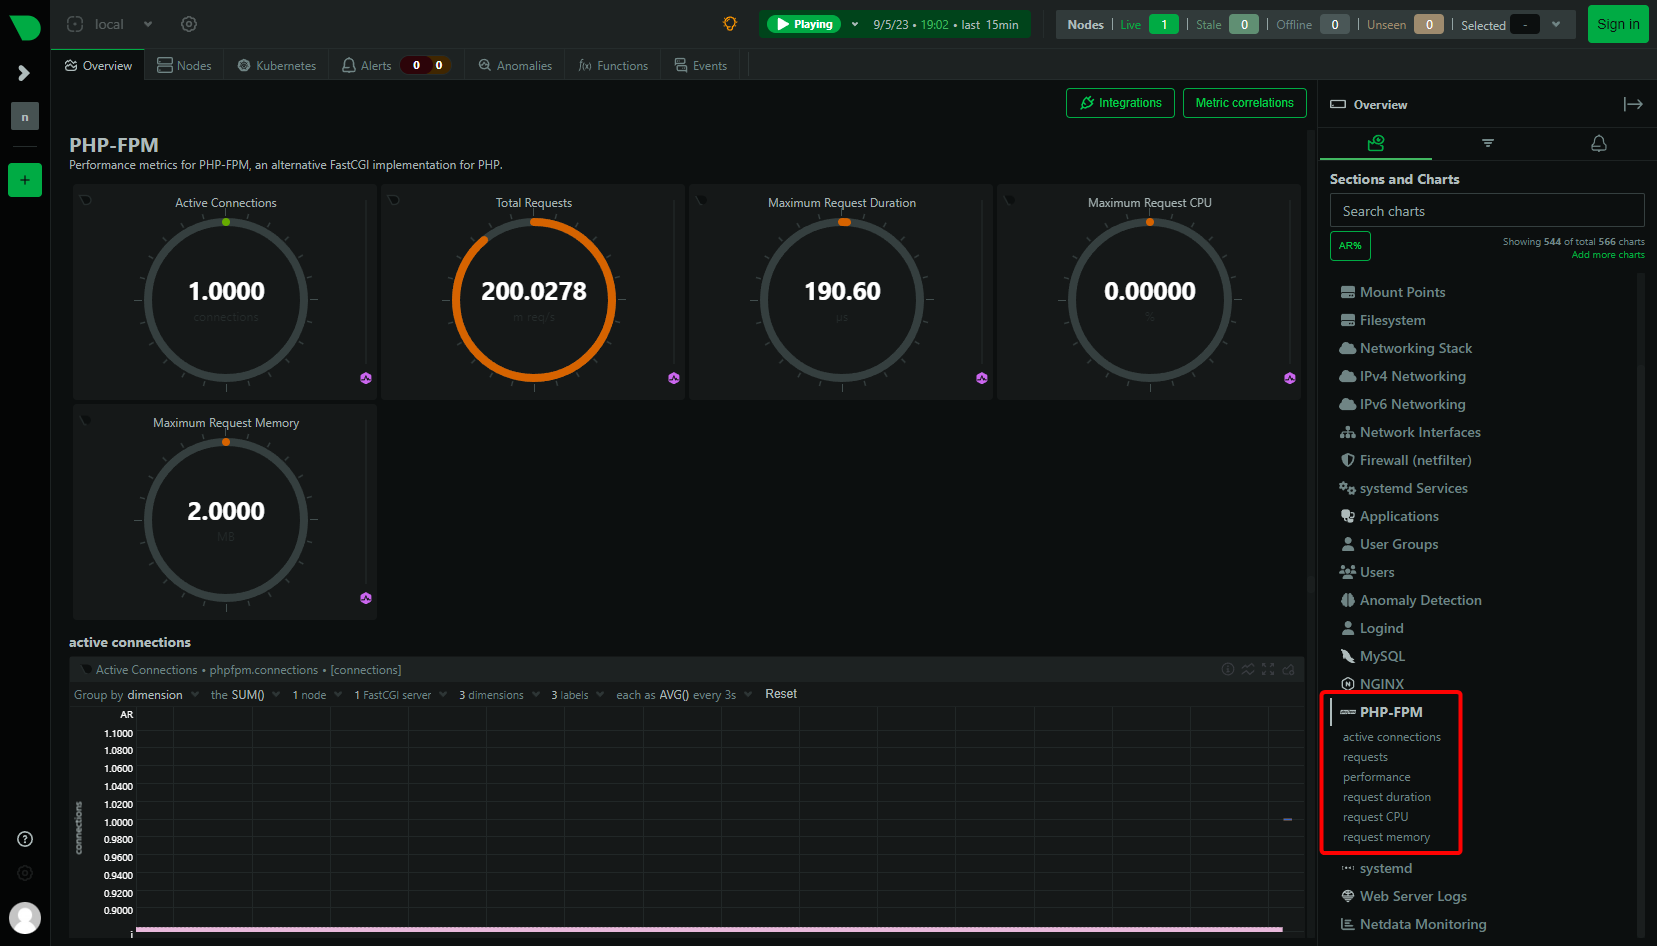
Reload the Netdata dashboard, and you should see the PHP-FPM stats.
Step 15 – Configure Docker Engine and Container Monitoring
Netdata can monitor both the Docker engine and Docker containers. It can also monitor apps running inside these containers, but we won’t be covering it in this tutorial.
Let us install Docker first.
$ curl -fsSL https://download.docker.com/linux/debian/gpg | sudo gpg --dearmor -o /etc/apt/keyrings/docker.gpg

$ echo

  "deb [arch="$(dpkg --print-architecture)" signed-by=/etc/apt/keyrings/docker.gpg] https://download.docker.com/linux/debian

  "$(. /etc/os-release && echo "$VERSION_CODENAME")" stable" |

  sudo tee /etc/apt/sources.list.d/docker.list > /dev/null

$ sudo apt update

$ sudo apt install docker-ce docker-ce-cli containerd.io

$ sudo usermod -aG docker ${USER}

$ su - ${USER}
Docker service is enabled and started. You can check the status of the service.
$ sudo systemctl status docker
To monitor the Docker engine, you need to enable the metrics feature of Docker.
Create and open the file /etc/docker/daemon.json for editing.
$ sudo nano /etc/docker/daemon.json
Paste the following code in it.
{

  "metrics-addr" : "127.0.0.1:9323",

  "experimental" : true

}
Save the file by pressing Ctrl + X and entering Y when prompted. This URL is used by Prometheus to track Docker engine statistics.
Create a configuration file for the Docker collector.
$ sudo /etc/netdata/edit-config go.d/docker.conf
Create another configuration file for the Docker engine for Prometheus.
$ sudo /etc/netdata/edit-config go.d/docker_engine.conf
Restart the Netdata and Docker services.
$ sudo systemctl restart docker netdata
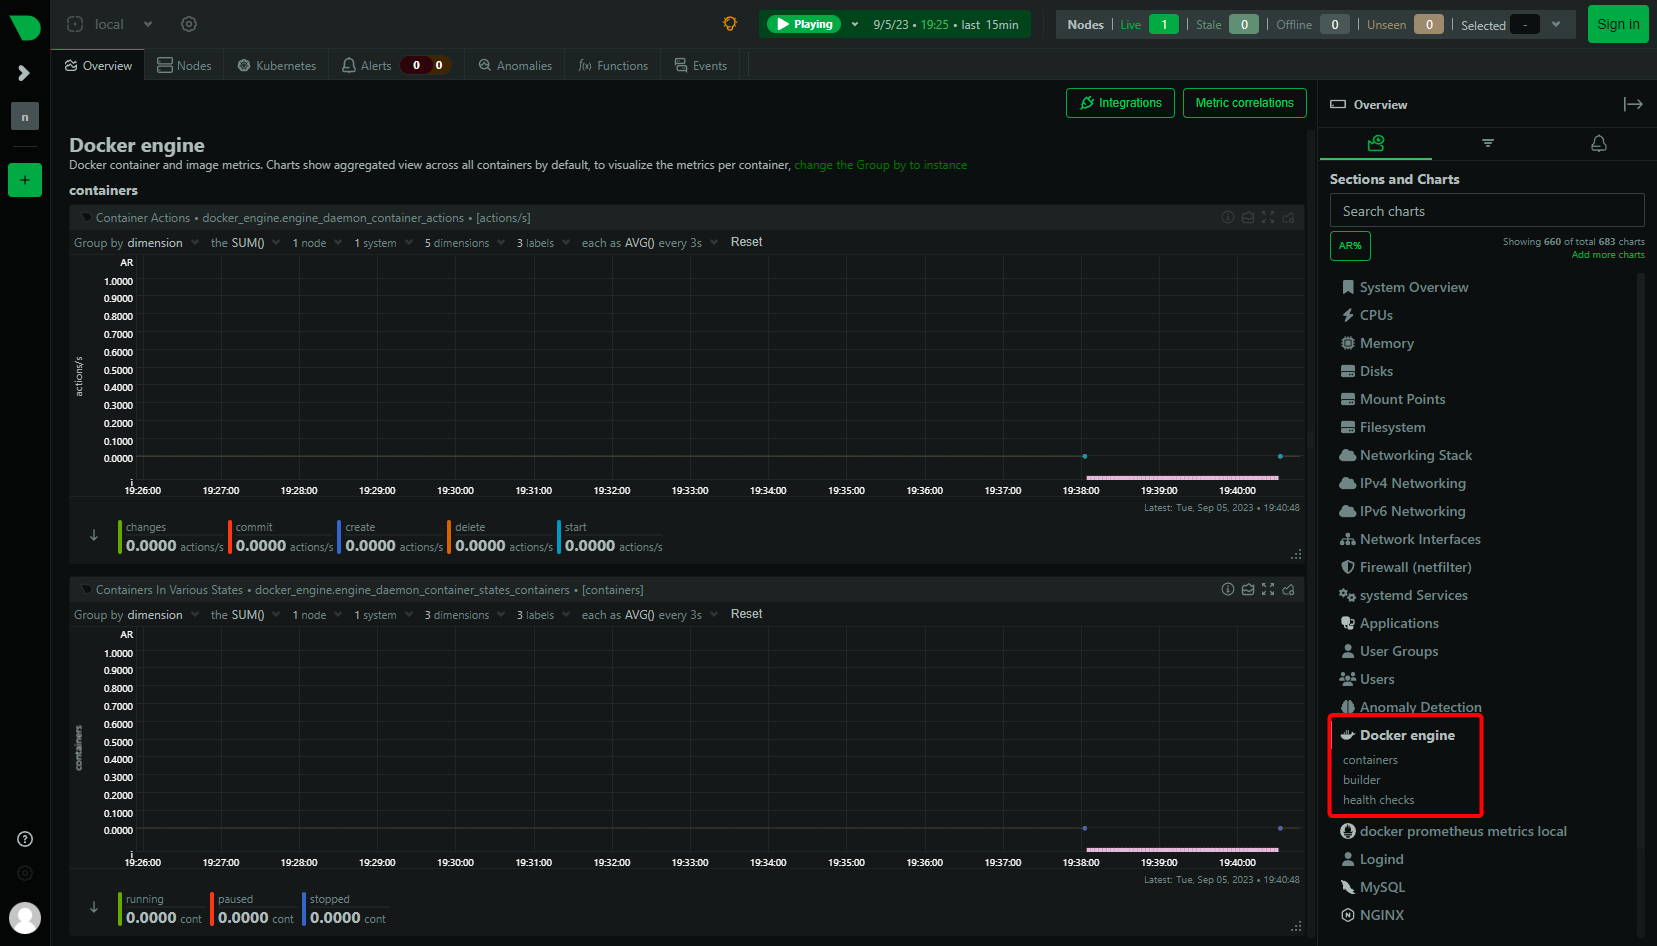
Load the Netdata dashboard again, and you can see the Docker statistics.
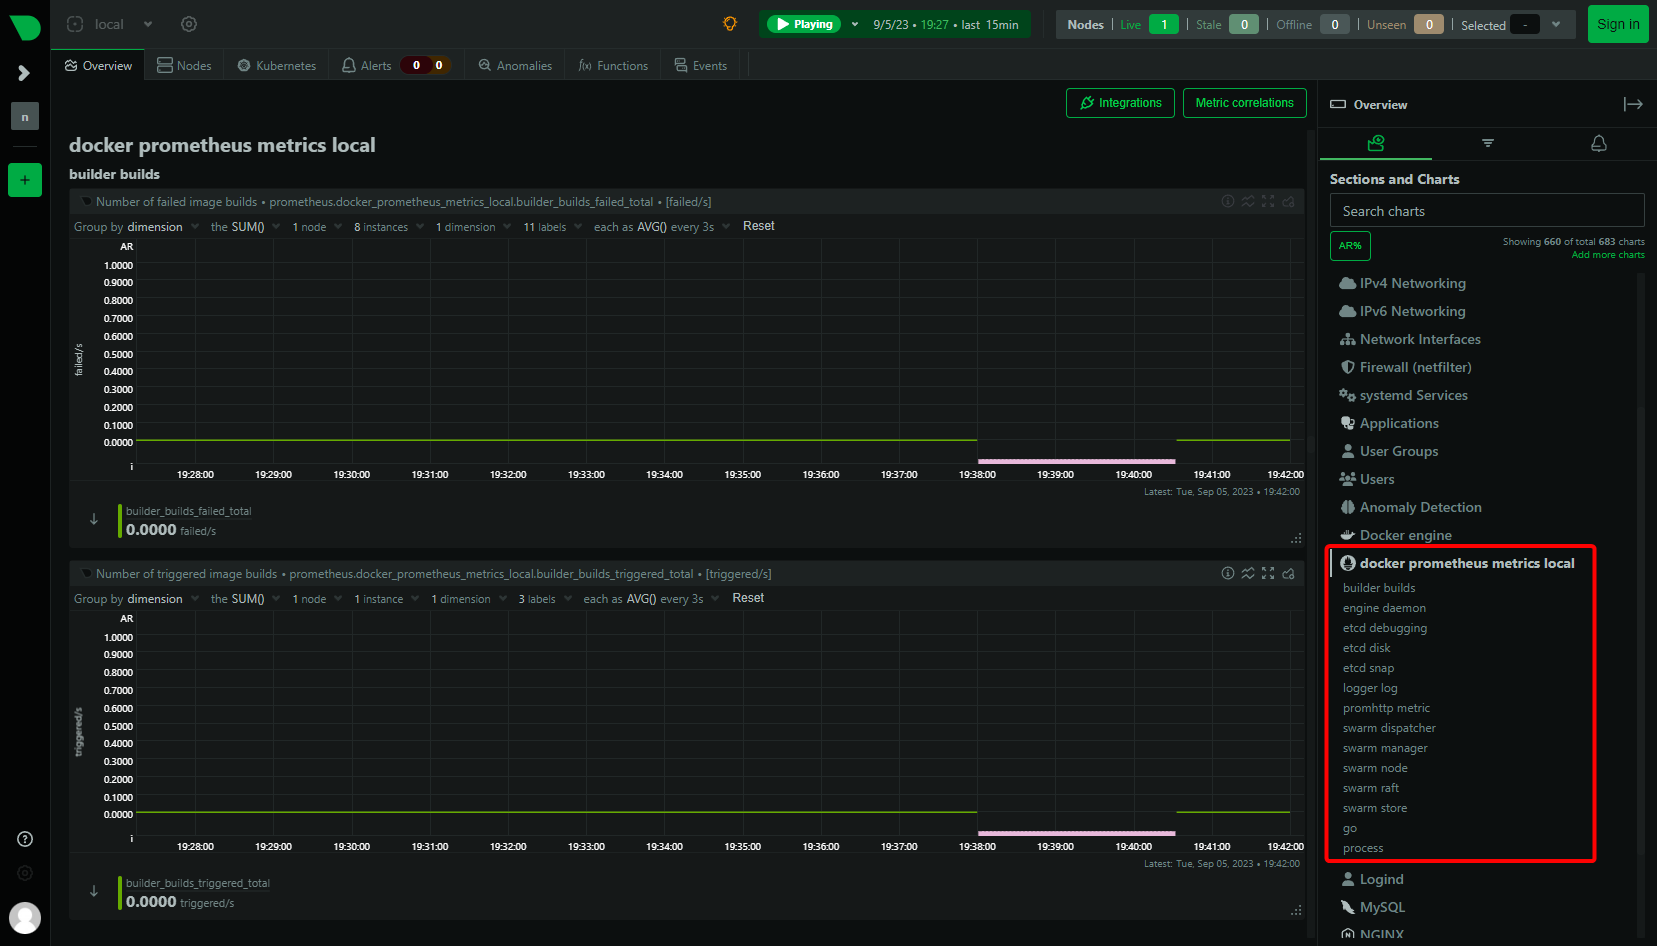
You will see another entry named Prometheus Metrics on your dashboard because the metrics option was made for the Prometheus dashboard.
The next step is to monitor the Docker container. Netdata uses control groups, referred to as cgroups to monitor Docker containers. Control groups is a Linux feature that limits and tracks the resource usage of a collection of processes, in this case, containers. If you have Docker containers running when you install Netdata, they are automatically tracked. However, if you run a container after installing Netdata, you need to restart it.
Run a test container.
$ docker container run -d nginx
Check the status of the container.
$ docker ps

CONTAINER ID   IMAGE     COMMAND                  CREATED         STATUS         PORTS     NAMES

9d6cde479224   nginx     "/docker-entrypoint.…"   7 seconds ago   Up 5 seconds   80/tcp    zealous_knuth
The container’s name is zealous_knuth as shown. Since the container has been started after installing Netdata, restart the service.
$ sudo systemctl restart netdata
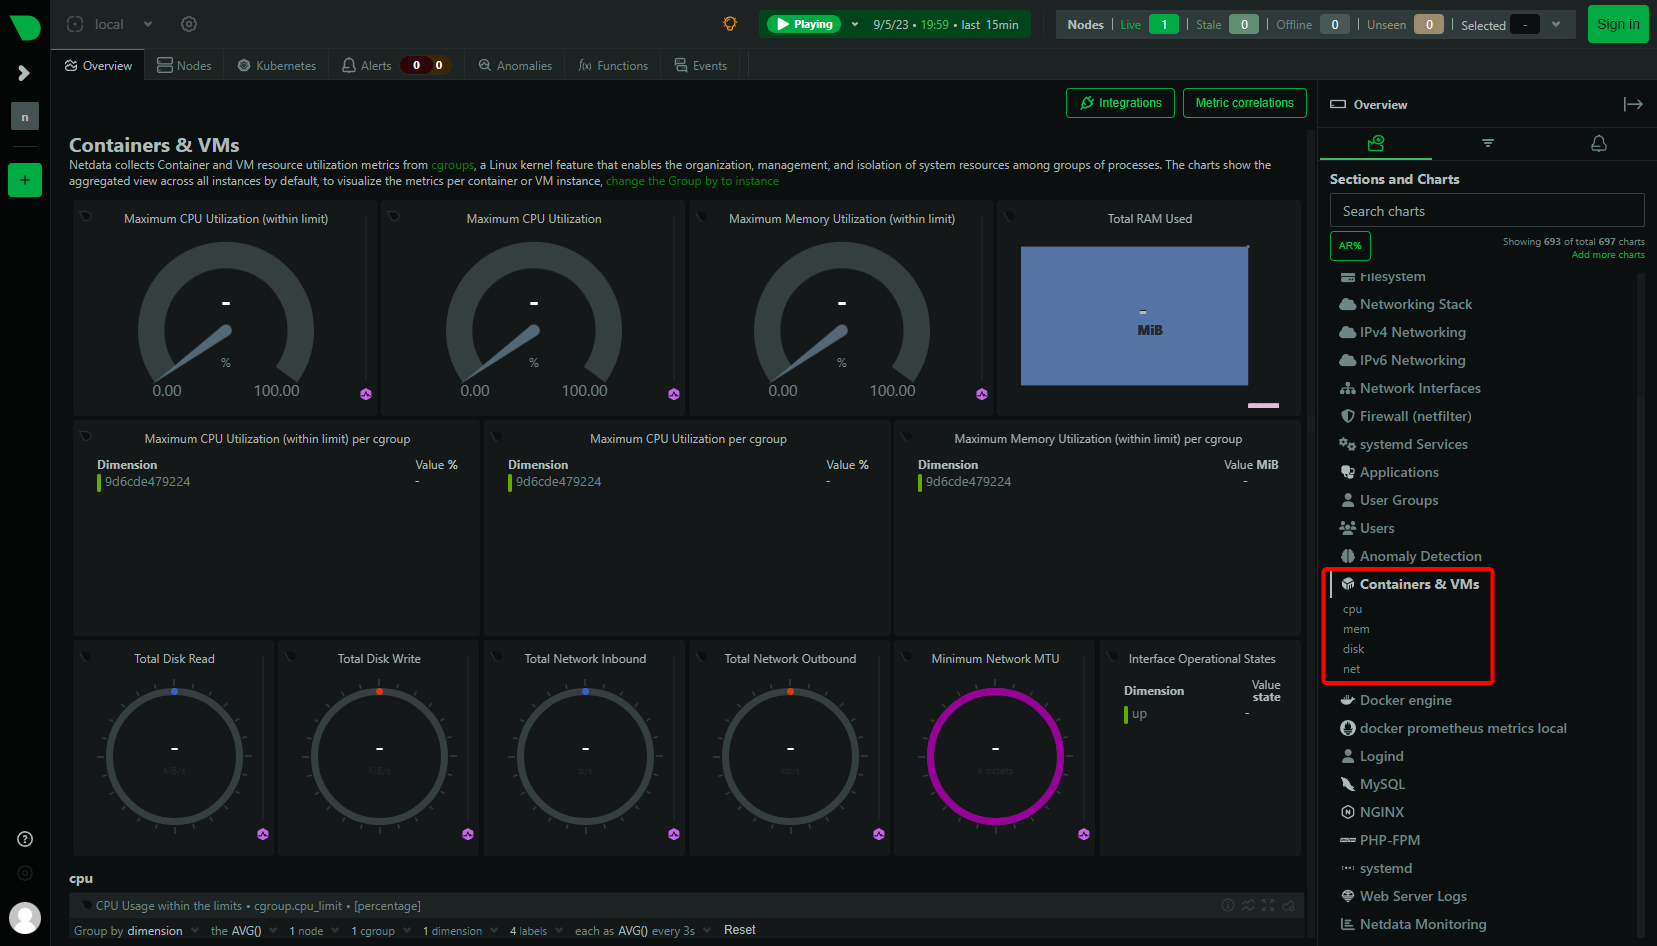
Load the Dashboard, and you should be able to see the Container stats. You can see the container ID in the stats.
Conclusion
This concludes our tutorial on installing and using the Netdata monitoring system to monitor various apps like Nginx, MySQL, PHP-FPM, and Docker on a Debian 12 server. If you have any questions, post them in the comments below.

Add Comment