Build a Monitoring System with Grafana and Prometheus on Debian 12
Grafana is an open-source and multi-platform data visualization platform developed by Grafana Labs. Grafana provides an interactive data visualization web application which includes charts, graphs, and alerts. With Grafana, you can query, visualize, set up alerts, and explore metrics, logs, and traces of TSDB. It is a powerful tool that turns time-series database (TSDB) data into an insightful graph and visualization.
In Grafana, you can add your time-series database data via the ‘Data Source’. Grafana supports multiple data sources such as Prometheus, InfluxDB, PostgreSQL, Loki, Jaeger, Graphite, Google Cloud Monitoring, AWS CloudWatch, Azure Monitor, and many more.
In this guide, you will install Grafana on the Debian 12 server with Nginx as a reverse proxy, then add Prometheus as the data source and configure the Grafana Dashboard for system monitoring.
Prerequisites
Before you proceed, make sure you have the following:
- A Debian 12 server for Grafana installation.
- A Debian 12 server with Prometheus and Node Exporter Installed – How to Install Prometheus and Node Exporter on Debian 12.
- A non-root user with sudo administrator privileges.
Adding Grafana Repository
In this guide, you will be installing Grafana via the official Grafana repository. To do that, you must add the Grafana repository to your Debian server.
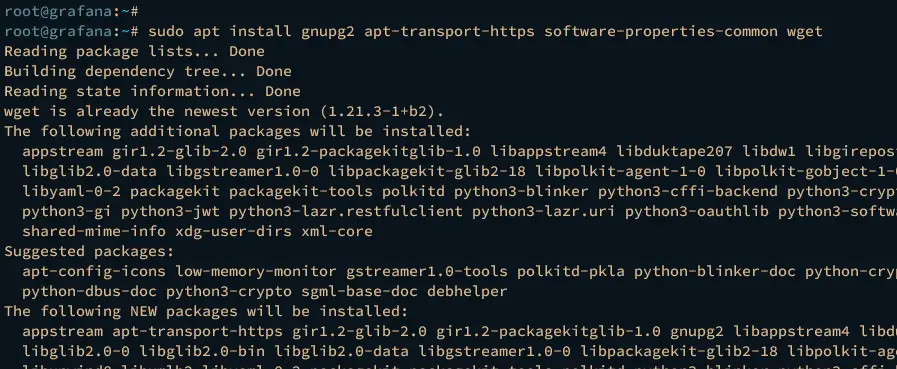
To get started, run the following command to install basic dependencies to your Debian machine.sudo apt install gnupg2 apt-transport-https software-properties-common wget
Now add the Grafana GPG key and repository by executing the following command.curl -fsSL https://packages.grafana.com/gpg.key | sudo gpg --dearmor -o /etc/apt/trusted.gpg.d/grafana.gpg
echo 'deb [signed-by=/etc/apt/trusted.gpg.d/grafana.gpg] https://packages.grafana.com/oss/deb stable main' | sudo tee /etc/apt/sources.list.d/grafana.list
Lastly, update and refresh your Debian package index to apply the changes.sudo apt update
Installing Grafana
Now that you’ve added the Grafana repository, you will be installing Grafana via APT. Then, you will configure the administrator user and password for your Grafana installation.
Install Grafana to your Debian system using the following command. Input y to proceed with the installation.sudo apt install grafana
After installation is completed, reload the systemd manager by executing the following command.sudo systemctl daemon-reload
Then, start and enable the grafana-server service using the command below.sudo systemctl start grafana-server
sudo systemctl enable grafana-server
Once the grafana-server is running, verify it using the command below. If everything goes well, you should see the grafana-server is enabled and running.sudo systemctl status grafana-server
Lastly, launch your web browser and visit your server IP address with default Grafana port 3000, such as http://192.168.5.20:3000/.
Input the default user admin and password admin, then click Login.
Now change the default admin password with a new password. Then click Submit to confirm.
When the process is finished, you should see the Grafana dashboard like the following:
Configuring Grafana
With Grafana installed, the next step is to configure Grafana by modifying the default configuration /etc/grafana/grafana.ini and set up the http_addr to localhost, http_port to 3000, and the domain with a local domain name grafana.hwdomain.io.
Open the default Grafana configuration /etc/grafana/grafana.ini using the following nano editor command.sudo nano /etc/grafana/grafana.ini
Change the default configuration with the following lines. In this example, you will run Grafana on localhost and with the local domain name grafana.hwdomain.io.[server]# The IP address to bind to, empty will bind to all interfaces
http_addr = localhost
# The http port to use
http_port = 3000
# The public facing domain name used to access grafana from a browser
domain = grafana.hwdomain.io
When you’re done, save and exit the file.
Now run the following systemctl command to restart the grafana-server and apply the changes. With this, your Grafana installation is running on localhost only.sudo systemctl restart grafana-server
Installing Nginx as a Reverse Proxy
In this guide, you will run Grafana with Nginx as a reverse proxy. Now, complete the following tasks to install and configure Nginx as a reverse proxy for your Grafana installation.
Run the following command to install the Nginx web server to your Debian machine. Input y to proceed with the installation.sudo apt install nginx
After Nginx is installed, run the following nano editor command to create a new server block file /etc/nginx/sites-available/grafana.conf.sudo nano /etc/nginx/sites-available/grafana.conf
Insert the following configuration and be sure to change the domain name within the server_name parameter.# This is required to proxy Grafana Live WebSocket connections.
map $http_upgrade $connection_upgrade {
default upgrade;
'' close;
}
server {
listen 80;
server_name grafana.hwdomain.io;
root /usr/share/nginx/html;
index index.html index.htm;
access_log /var/log/nginx/grafana-access.log;
error_log /var/log/nginx/grafana-error.log;
location / {
proxy_set_header Host $http_host;
proxy_pass http://localhost:3000/;
}
# Proxy Grafana Live WebSocket connections.
location /api/live {
rewrite ^/(.*) /$1 break;
proxy_http_version 1.1;
proxy_set_header Upgrade $http_upgrade;
proxy_set_header Connection $connection_upgrade;
proxy_set_header Host $http_host;
proxy_pass http://localhost:3000/;
}
}
Save and close the file when finished.
Next, run the following command to activate the server block file /etc/nginx/sites-available/grafana.conf. Then, verify your Nginx syntax to ensure that you have proper syntax.sudo ln -s /etc/nginx/sites-available/grafana.conf /etc/nginx/sites-enabled/
sudo nginx -t
If you have the correct Nginx syntax, you should get the output ‘test is successful – syntax is ok‘.
Lasy, run the following systemctl command to restart the Nginx service and apply the changes. Then, verify Nginx to ensure that the service is running.sudo systemctl restart nginx
sudo systemctl status nginx
In the following output, you should see the Nginx service is running.
To access your Grafana server, you can modify the /etc/hosts file on your local machine if you’re a Linux or MacOS user. For Windows users, edit the file C:WindowsSystem32driversetchosts as administration.
Input the following configuration to the file.192.168.5.15 grafana.hwdomain.io
Save and close the file when finished.
Now back to the web browser and visit your local domain name for the Grafana server, such as http://grafana.hwdomain.io/. If your configuration is successful, you will be redirected to the Grafana login page.
Log in with your admin user and password, then click Login to confirm.
Now you should get the Grafana admin dashboard.
Adding Authentication to the Prometheus Server
Before adding Prometheus to Grafana, you will set up basic authentication for Prometheus. You will generate the basic authentication password with apache2-utils, then enable basic_auth for the Prometheus server.
In this example, the Prometheus and Node Exporter are installed on different servers with IP address 192.168.5.15 and the hostname prometheus.
Log in to the Prometheus server and install the apache2-utils package via the apt command below.sudo apt install apache2-utils -y
After that, generate the new password for the Prometheus basic authentication. Input your password and copy the generated password to your note.htpasswd -nB promadmin
Now, create a new Prometheus configuration /etc/prometheus/web.yml using the following nano editor command.sudo nano /etc/prometheus/web.yml
Add the following configuration to secure the Prometheus administration dashboard with the basic_auth module.# basic_auth
basic_auth_users:
promadmin: $2y$05$UlvHd4An.oQRt2UdUXzr9eZ6ShRLe3xYbMhw8ePfvGeLuu0khO4Bu
Save and close the file when finished.
Next, open the default Prometheus configuration /etc/prometheus/prometheus.yml using the following nano editor command.sudo nano /etc/prometheus/prometheus.yml
Add the basic_auth configuration below within the Prometheus job. Be sure to change the details user and password with your data.scrape_configs:
# The job name is added as a label `job=<job_name>` to any timeseries scraped from this config.
- job_name: "prometheus"
# metrics_path defaults to '/metrics'
# scheme defaults to 'http'.
# Add settings for certificate and authentication
scheme: http
basic_auth:
username: 'promadmin'
password: 'password'
Save and close the file when you’re done.
Next, run the following command to edit the prometheus service file.sudo systemctl edit --full prometheus
Change the default ExecStart option with the following.ExecStart=/usr/bin/prometheus --config.file=/etc/prometheus/prometheus.yml --web.config.file=/etc/prometheus/web.yml
Save and close the file when finished.
Now, run the following systemctl command to reload the systemd manager and apply the changes. Then, restart the prometheus service.sudo systemctl daemon-reload
sudo systemctl restart prometheus
Verify the prometheus service using the below command.sudo systemctl status prometheus
Within the ExecStart section, the command has changed like the following.
Lastly, open your web browser and visit the Prometheus IP address with port 9090 (i.e: http://192.168.10.15:9090/). You will be prompted with the Prometheus basic_auth, input your admin user and password, then click Sign In.
If your configuration is successful, you should see the Prometheus dashboard like the following.
Integrating Prometheus with Grafana Dashboard
After configuring Basic authentication on Prometheus, you can add Prometheus as the data source to the Grafana dashboard. There are two steps that you must complete: add Prometheus as the data source and then import or create a Grafana dashboard for your system monitoring.
Adding Prometheus Data Source
Back to the Grafana Dashboard, click the Connections menu, and select Data source.
Click Add data source to continue.
Select the time series database Prometheus.
Input the name of the new data source and Prometheus host to http://192.168.5.15:9090/. Within the Authentication section, select Basic Authentication and input the username and password for Prometheus.
Scroll down and click Save & test to confirm. The output ‘Successfully queried the Prometheus API.‘ confirms that Prometheus has been added to Grafana.
Importing Dashboard Monitoring
Click the + menu at the top-right and select Import Dashboard.
Find your desired Dashboard at https://grafana.com/grafana/dashboards/. Then, copy and paste the dashboard ID, and click Load to confirm. In this case, we’ll be using Dashboard ID 15172.
Input the dashboard name and select the Prometheus data source. Then click Import to confirm.
Below is an example of the improved Grafana Dashboard with Prometheus to monitor the system.
You have now successfully installed Grafana on a Debian 12 server with Nginx as a reverse proxy, added Prometheus as the data source to Grafana, and imported the Grafana dashboard for system monitoring.
Đăng ký liền tay Nhận Ngay Bài Mới
Subscribe ngay
Cám ơn bạn đã đăng ký !
Lỗi đăng ký !


Add Comment