Introduction
When running multiple services and applications on a Kubernetes cluster, a centralized, cluster-level logging stack can help you quickly sort through and analyze the heavy volume of log data produced by your Pods. One popular centralized logging solution is the Elasticsearch, Fluentd, and Kibana (EFK) stack.
Elasticsearch is a real-time, distributed, and scalable search engine which allows for full-text and structured search, as well as analytics. It is commonly used to index and search through large volumes of log data, but can also be used to search many different kinds of documents.
Elasticsearch is commonly deployed alongside Kibana, a powerful data visualization frontend and dashboard for Elasticsearch. Kibana allows you to explore your Elasticsearch log data through a web interface, and build dashboards and queries to quickly answer questions and gain insight into your Kubernetes applications.
In this tutorial we’ll use Fluentd to collect, transform, and ship log data to the Elasticsearch backend. Fluentd is a popular open-source data collector that we’ll set up on our Kubernetes nodes to tail container log files, filter and transform the log data, and deliver it to the Elasticsearch cluster, where it will be indexed and stored.
We’ll begin by configuring and launching a scalable Elasticsearch cluster, and then create the Kibana Kubernetes Service and Deployment. To conclude, we’ll set up Fluentd as a DaemonSet so it runs on every Kubernetes worker node.
Prerequisites
Before you begin with this guide, ensure you have the following available to you:
- A Kubernetes 1.10+ cluster with role-based access control (RBAC) enabled
- Ensure your cluster has enough resources available to roll out the EFK stack, and if not scale your cluster by adding worker nodes. We’ll be deploying a 3-Pod Elasticsearch cluster (you can scale this down to 1 if necessary), as well as a single Kibana Pod. Every worker node will also run a Fluentd Pod. The cluster in this guide consists of 3 worker nodes and a managed control plane.
- The
kubectlcommand-line tool installed on your local machine, configured to connect to your cluster. You can read more about installingkubectlin the official documentation.
Once you have these components set up, you’re ready to begin with this guide.
Step 1 — Creating a Namespace
Before we roll out an Elasticsearch cluster, we’ll first create a Namespace into which we’ll install all of our logging instrumentation. Kubernetes lets you separate objects running in your cluster using a “virtual cluster” abstraction called Namespaces. In this guide, we’ll create a kube-logging namespace into which we’ll install the EFK stack components. This Namespace will also allow us to quickly clean up and remove the logging stack without any loss of function to the Kubernetes cluster.
To begin, first investigate the existing Namespaces in your cluster using kubectl:
kubectl get namespaces
You should see the following three initial Namespaces, which come preinstalled with your Kubernetes cluster:
Output
NAME          STATUS    AGE
default       Active    5m
kube-system   Active    5m
kube-public   Active    5m
The default Namespace houses objects that are created without specifying a Namespace. The kube-system Namespace contains objects created and used by the Kubernetes system, like kube-dns, kube-proxy, and kubernetes-dashboard. It’s good practice to keep this Namespace clean and not pollute it with your application and instrumentation workloads.
The kube-public Namespace is another automatically created Namespace that can be used to store objects you’d like to be readable and accessible throughout the whole cluster, even to unauthenticated users.
To create the kube-logging Namespace, first open and edit a file called kube-logging.yaml using your favorite editor, such as nano:
nano kube-logging.yaml
Inside your editor, paste the following Namespace object YAML:
Here, we specify the Kubernetes object’s kind as a Namespace object. To learn more about Namespace objects, consult the Namespaces Walkthrough in the official Kubernetes documentation. We also specify the Kubernetes API version used to create the object (v1), and give it a name, kube-logging.
Once you’ve created the kube-logging.yaml Namespace object file, create the Namespace using kubectl create with the -f filename flag:
kubectl create -f kube-logging.yaml
You should see the following output:
Output
namespace/kube-logging created
You can then confirm that the Namespace was successfully created:
kubectl get namespaces
At this point, you should see the new kube-logging Namespace:
NAME           STATUS    AGE
default        Active    23m
kube-logging   Active    1m
kube-public    Active    23m
kube-system    Active    23m
We can now deploy an Elasticsearch cluster into this isolated logging Namespace.
Step 2 — Creating the Elasticsearch StatefulSet
Now that we’ve created a Namespace to house our logging stack, we can begin rolling out its various components. We’ll first begin by deploying a 3-node Elasticsearch cluster.
In this guide, we use 3 Elasticsearch Pods to avoid the “split-brain” issue that occurs in highly-available, multi-node clusters. At a high-level, “split-brain” is what arises when one or more nodes can’t communicate with the others, and several “split” masters get elected. With 3 nodes, if one gets disconnected from the cluster temporarily, the other two nodes can elect a new master and the cluster can continue functioning while the last node attempts to rejoin. To learn more, consult A new era for cluster coordination in Elasticsearch and Voting configurations.
Creating the Headless Service
To start, we’ll create a headless Kubernetes service called elasticsearch that will define a DNS domain for the 3 Pods. A headless service does not perform load balancing or have a static IP; to learn more about headless services, consult the official Kubernetes documentation.
Open a file called elasticsearch_svc.yaml using your favorite editor:
nano elasticsearch_svc.yaml
Paste in the following Kubernetes service YAML:
We define a Service called elasticsearch in the kube-logging Namespace, and give it the app: elasticsearch label. We then set the .spec.selector to app: elasticsearch so that the Service selects Pods with the app: elasticsearch label. When we associate our Elasticsearch StatefulSet with this Service, the Service will return DNS A records that point to Elasticsearch Pods with the app: elasticsearch label.
We then set clusterIP: None, which renders the service headless. Finally, we define ports 9200 and 9300 which are used to interact with the REST API, and for inter-node communication, respectively.
Create the service using kubectl:
You should see the following output:
Output
service/elasticsearch created
Finally, double-check that the service was successfully created using kubectl get:
kubectl get services --namespace=kube-logging
You should see the following:
Output
NAME TYPE CLUSTER-IP EXTERNAL-IP PORT(S) AGE

elasticsearch ClusterIP None <none> 9200/TCP,9300/TCP 26s
Now that we’ve set up our headless service and a stable .elasticsearch.kube-logging.svc.cluster.local domain for our Pods, we can go ahead and create the StatefulSet.
Creating the StatefulSet
A Kubernetes StatefulSet allows you to assign a stable identity to Pods and grant them stable, persistent storage. Elasticsearch requires stable storage to persist data across Pod rescheduling and restarts. To learn more about the StatefulSet workload, consult the Statefulsets page from the Kubernetes docs.
Open a file called elasticsearch_statefulset.yaml in your favorite editor:
We will move through the StatefulSet object definition section by section, pasting blocks into this file.
Begin by pasting in the following block:
We specify 3 replicas (Pods) and set the matchLabels selector to app: elasticseach, which we then mirror in the .spec.template.metadata section. The .spec.selector.matchLabels and .spec.template.metadata.labels fields must match.
We can now move on to the object spec. Paste in the following block of YAML immediately below the preceding block:
We then use the resources field to specify that the container needs at least 0.1 vCPU guaranteed to it, and can burst up to 1 vCPU (which limits the Pod’s resource usage when performing an initial large ingest or dealing with a load spike). You should modify these values depending on your anticipated load and available resources. To learn more about resource requests and limits, consult the official Kubernetes Documentation.
We then open and name ports 9200 and 9300 for REST API and inter-node communication, respectively. We specify a volumeMount called data that will mount the PersistentVolume named data to the container at the path /usr/share/elasticsearch/data. We will define the VolumeClaims for this StatefulSet in a later YAML block.
Finally, we set some environment variables in the container:
cluster.name: The Elasticsearch cluster’s name, which in this guide isk8s-logs.node.name: The node’s name, which we set to the.metadata.namefield usingvalueFrom. This will resolve toes-cluster-[0,1,2], depending on the node’s assigned ordinal.discovery.seed_hosts: This field sets a list of master-eligible nodes in the cluster that will seed the node discovery process. In this guide, thanks to the headless service we configured earlier, our Pods have domains of the formes-cluster-[0,1,2].elasticsearch.kube-logging.svc.cluster.local, so we set this variable accordingly. Using local namespace Kubernetes DNS resolution, we can shorten this toes-cluster-[0,1,2].elasticsearch. To learn more about Elasticsearch discovery, consult the official Elasticsearch documentation.cluster.initial_master_nodes: This field also specifies a list of master-eligible nodes that will participate in the master election process. Note that for this field you should identify nodes by theirnode.name, and not their hostnames.ES_JAVA_OPTS: Here we set this to-Xms512m -Xmx512mwhich tells the JVM to use a minimum and maximum heap size of 512 MB. You should tune these parameters depending on your cluster’s resource availability and needs. To learn more, consult Setting the heap size.
The next block we’ll paste in looks as follows:
The first, named fix-permissions, runs a chown command to change the owner and group of the Elasticsearch data directory to 1000:1000, the Elasticsearch user’s UID. By default Kubernetes mounts the data directory as root, which renders it inaccessible to Elasticsearch. To learn more about this step, consult Elasticsearch’s “Notes for production use and defaults.”
The second, named increase-vm-max-map, runs a command to increase the operating system’s limits on mmap counts, which by default may be too low, resulting in out of memory errors. To learn more about this step, consult the official Elasticsearch documentation.
The next Init Container to run is increase-fd-ulimit, which runs the ulimit command to increase the maximum number of open file descriptors. To learn more about this step, consult the “Notes for Production Use and Defaults” from the official Elasticsearch documentation.
Note: The Elasticsearch Notes for Production Use also mentions disabling swapping for performance reasons. Depending on your Kubernetes installation or provider, swapping may already be disabled. To check this, exec into a running container and run cat /proc/swaps to list active swap devices. If you see nothing there, swap is disabled.
Now that we’ve defined our main app container and the Init Containers that run before it to tune the container OS, we can add the final piece to our StatefulSet object definition file: the volumeClaimTemplates.
Paste in the following volumeClaimTemplate block:
We then specify its access mode as ReadWriteOnce, which means that it can only be mounted as read-write by a single node. We define the storage class as do-block-storage in this guide since we use a DigitalOcean Kubernetes cluster for demonstration purposes. You should change this value depending on where you are running your Kubernetes cluster. To learn more, consult the Persistent Volume documentation.
Finally, we specify that we’d like each PersistentVolume to be 100GiB in size. You should adjust this value depending on your production needs.
The complete StatefulSet spec should look something like this:
Now, deploy the StatefulSet using kubectl:
- kubectl create -f elasticsearch_statefulset.yaml
statefulset.apps/es-cluster created
You can monitor the StatefulSet as it is rolled out using kubectl rollout status:
- kubectl rollout status sts/es-cluster –namespace=kube-logging
Waiting for 3 pods to be ready...
Waiting for 2 pods to be ready...
Waiting for 1 pods to be ready...
partitioned roll out complete: 3 new pods have been updated...
Once all the Pods have been deployed, you can check that your Elasticsearch cluster is functioning correctly by performing a request against the REST API.
To do so, first forward the local port 9200 to the port 9200 on one of the Elasticsearch nodes (es-cluster-0) using kubectl port-forward:
- kubectl port-forward es-cluster-0 9200:9200 –namespace=kube-logging
curl request against the REST API:- curl http://localhost:9200/_cluster/state?pretty
{
  "cluster_name" : "k8s-logs",
  "compressed_size_in_bytes" : 348,
  "cluster_uuid" : "QD06dK7CQgids-GQZooNVw",
  "version" : 3,
  "state_uuid" : "mjNIWXAzQVuxNNOQ7xR-qg",
  "master_node" : "IdM5B7cUQWqFgIHXBp0JDg",
  "blocks" : { },
  "nodes" : {
    "u7DoTpMmSCixOoictzHItA" : {
      "name" : "es-cluster-1",
      "ephemeral_id" : "ZlBflnXKRMC4RvEACHIVdg",
      "transport_address" : "10.244.8.2:9300",
      "attributes" : { }
    },
    "IdM5B7cUQWqFgIHXBp0JDg" : {
      "name" : "es-cluster-0",
      "ephemeral_id" : "JTk1FDdFQuWbSFAtBxdxAQ",
      "transport_address" : "10.244.44.3:9300",
      "attributes" : { }
    },
    "R8E7xcSUSbGbgrhAdyAKmQ" : {
      "name" : "es-cluster-2",
      "ephemeral_id" : "9wv6ke71Qqy9vk2LgJTqaA",
      "transport_address" : "10.244.40.4:9300",
      "attributes" : { }
    }
  },
...
This indicates that our Elasticsearch cluster k8s-logs has successfully been created with 3 nodes: es-cluster-0, es-cluster-1, and es-cluster-2. The current master node is es-cluster-0.
Now that your Elasticsearch cluster is up and running, you can move on to setting up a Kibana frontend for it.
Step 3 — Creating the Kibana Deployment and Service
To launch Kibana on Kubernetes, we’ll create a Service called kibana, and a Deployment consisting of one Pod replica. You can scale the number of replicas depending on your production needs, and optionally specify a LoadBalancer type for the Service to load balance requests across the Deployment pods.
This time, we’ll create the Service and Deployment in the same file. Open up a file called kibana.yaml in your favorite editor:
nano kibana.yaml
Paste in the following service spec:
In this spec we’ve defined a service called kibana in the kube-logging namespace, and gave it the app: kibana label.
We’ve also specified that it should be accessible on port 5601 and use the app: kibana label to select the Service’s target Pods.
In the Deployment spec, we define a Deployment called kibana and specify that we’d like 1 Pod replica.
We use the docker.elastic.co/kibana/kibana:7.2.0 image. At this point you may substitute your own private or public Kibana image to use.
We specify that we’d like at the very least 0.1 vCPU guaranteed to the Pod, bursting up to a limit of 1 vCPU. You may change these parameters depending on your anticipated load and available resources.
Next, we use the ELASTICSEARCH_URL environment variable to set the endpoint and port for the Elasticsearch cluster. Using Kubernetes DNS, this endpoint corresponds to its Service name elasticsearch. This domain will resolve to a list of IP addresses for the 3 Elasticsearch Pods. To learn more about Kubernetes DNS, consult DNS for Services and Pods.
Finally, we set Kibana’s container port to 5601, to which the kibana Service will forward requests.
Once you’re satisfied with your Kibana configuration, you can roll out the Service and Deployment using kubectl:
- kubectl create -f kibana.yaml
You should see the following output:
uOutput
service/kibana created
deployment.apps/kibana created
You can check that the rollout succeeded by running the following command:
- kubectl rollout status deployment/kibana –namespace=kube-logging
You should see the following output:
deployment "kibana" successfully rolled out
To access the Kibana interface, we’ll once again forward a local port to the Kubernetes node running Kibana. Grab the Kibana Pod details using kubectl get:
- kubectl get pods –namespace=kube-logging
NAME                      READY     STATUS    RESTARTS   AGE
es-cluster-0              1/1       Running   0          55m
es-cluster-1              1/1       Running   0          54m
es-cluster-2              1/1       Running   0          54m
kibana-6c9fb4b5b7-plbg2   1/1       Running   0          4m27s
Here we observe that our Kibana Pod is called kibana-6c9fb4b5b7-plbg2.
Forward the local port 5601 to port 5601 on this Pod:
- kubectl port-forward kibana-6c9fb4b5b7-plbg2 5601:5601 –namespace=kube-logging
You should see the following output:
Forwarding from 127.0.0.1:5601 -> 5601
Forwarding from [::1]:5601 -> 5601
Now, in your web browser, visit the following URL:
http://localhost:5601
If you see the following Kibana welcome page, you’ve successfully deployed Kibana into your Kubernetes cluster:

You can now move on to rolling out the final component of the EFK stack: the log collector, Fluentd.
Step 4 — Creating the Fluentd DaemonSet
In this guide, we’ll set up Fluentd as a DaemonSet, which is a Kubernetes workload type that runs a copy of a given Pod on each Node in the Kubernetes cluster. Using this DaemonSet controller, we’ll roll out a Fluentd logging agent Pod on every node in our cluster. To learn more about this logging architecture, consult “Using a node logging agent” from the official Kubernetes docs.
In Kubernetes, containerized applications that log to stdout and stderr have their log streams captured and redirected to JSON files on the nodes. The Fluentd Pod will tail these log files, filter log events, transform the log data, and ship it off to the Elasticsearch logging backend we deployed in Step 2.
In addition to container logs, the Fluentd agent will tail Kubernetes system component logs like kubelet, kube-proxy, and Docker logs. To see a full list of sources tailed by the Fluentd logging agent, consult the kubernetes.conf file used to configure the logging agent. To learn more about logging in Kubernetes clusters, consult “Logging at the node level” from the official Kubernetes documentation.
Begin by opening a file called fluentd.yaml in your favorite text editor:
First, paste in the following ServiceAccount definition:
Next, paste in the following ClusterRole block:
Now, paste in the following ClusterRoleBinding block:
At this point we can begin pasting in the actual DaemonSet spec:
Next, paste in the following section:
Next, we define a NoSchedule toleration to match the equivalent taint on Kubernetes master nodes. This will ensure that the DaemonSet also gets rolled out to the Kubernetes masters. If you don’t want to run a Fluentd Pod on your master nodes, remove this toleration. To learn more about Kubernetes taints and tolerations, consult “Taints and Tolerations” from the official Kubernetes docs.
Next, we begin defining the Pod container, which we call fluentd.
We use the official v1.4.2 Debian image provided by the Fluentd maintainers. If you’d like to use your own private or public Fluentd image, or use a different image version, modify the image tag in the container spec. The Dockerfile and contents of this image are available in Fluentd’s fluentd-kubernetes-daemonset Github repo.
Next, we configure Fluentd using some environment variables:
FLUENT_ELASTICSEARCH_HOST: We set this to the Elasticsearch headless Service address defined earlier:elasticsearch.kube-logging.svc.cluster.local. This will resolve to a list of IP addresses for the 3 Elasticsearch Pods. The actual Elasticsearch host will most likely be the first IP address returned in this list. To distribute logs across the cluster, you will need to modify the configuration for Fluentd’s Elasticsearch Output plugin. To learn more about this plugin, consult Elasticsearch Output Plugin.FLUENT_ELASTICSEARCH_PORT: We set this to the Elasticsearch port we configured earlier,9200.FLUENT_ELASTICSEARCH_SCHEME: We set this tohttp.FLUENTD_SYSTEMD_CONF: We set this todisableto suppress output related tosystemdnot being set up in the container.
Finally, paste in the following section:
Next, we mount the /var/log and /var/lib/docker/containers host paths into the container using the varlog and varlibdockercontainers volumeMounts. These volumes are defined at the end of the block.
The final parameter we define in this block is terminationGracePeriodSeconds, which gives Fluentd 30 seconds to shut down gracefully upon receiving a SIGTERM signal. After 30 seconds, the containers are sent a SIGKILL signal. The default value for terminationGracePeriodSeconds is 30s, so in most cases this parameter can be omitted. To learn more about gracefully terminating Kubernetes workloads, consult Google’s “Kubernetes best practices: terminating with grace.”
The entire Fluentd spec should look something like this:
Now, roll out the DaemonSet using kubectl:
- kubectl create -f fluentd.yaml
You should see the following output:
serviceaccount/fluentd created
clusterrole.rbac.authorization.k8s.io/fluentd created
clusterrolebinding.rbac.authorization.k8s.io/fluentd created
daemonset.extensions/fluentd created
Verify that your DaemonSet rolled out successfully using kubectl:
- kubectl get ds –namespace=kube-logging
You should see the following status output:
NAME      DESIRED   CURRENT   READY     UP-TO-DATE   AVAILABLE   NODE SELECTOR   AGE
fluentd   3         3         3         3            3           <none>          58s
This indicates that there are 3 fluentd Pods running, which corresponds to the number of nodes in our Kubernetes cluster.
We can now check Kibana to verify that log data is being properly collected and shipped to Elasticsearch.
With the kubectl port-forward still open, navigate to http://localhost:5601.
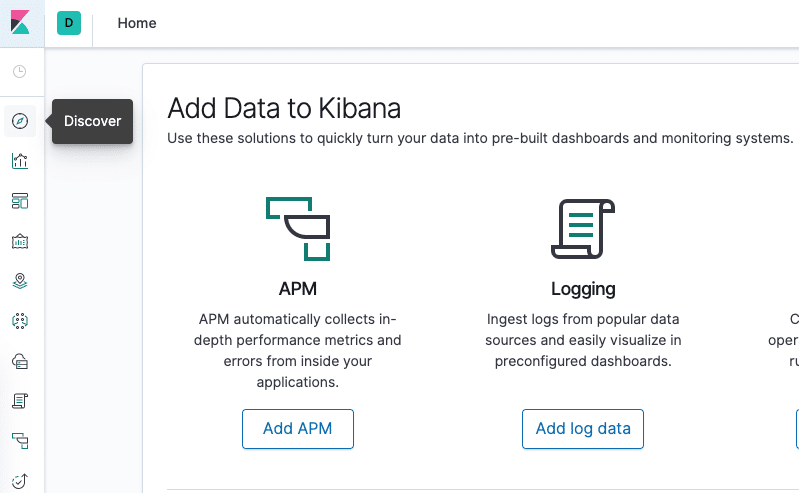
Click on Discover in the left-hand navigation menu:
You should see the following configuration window:
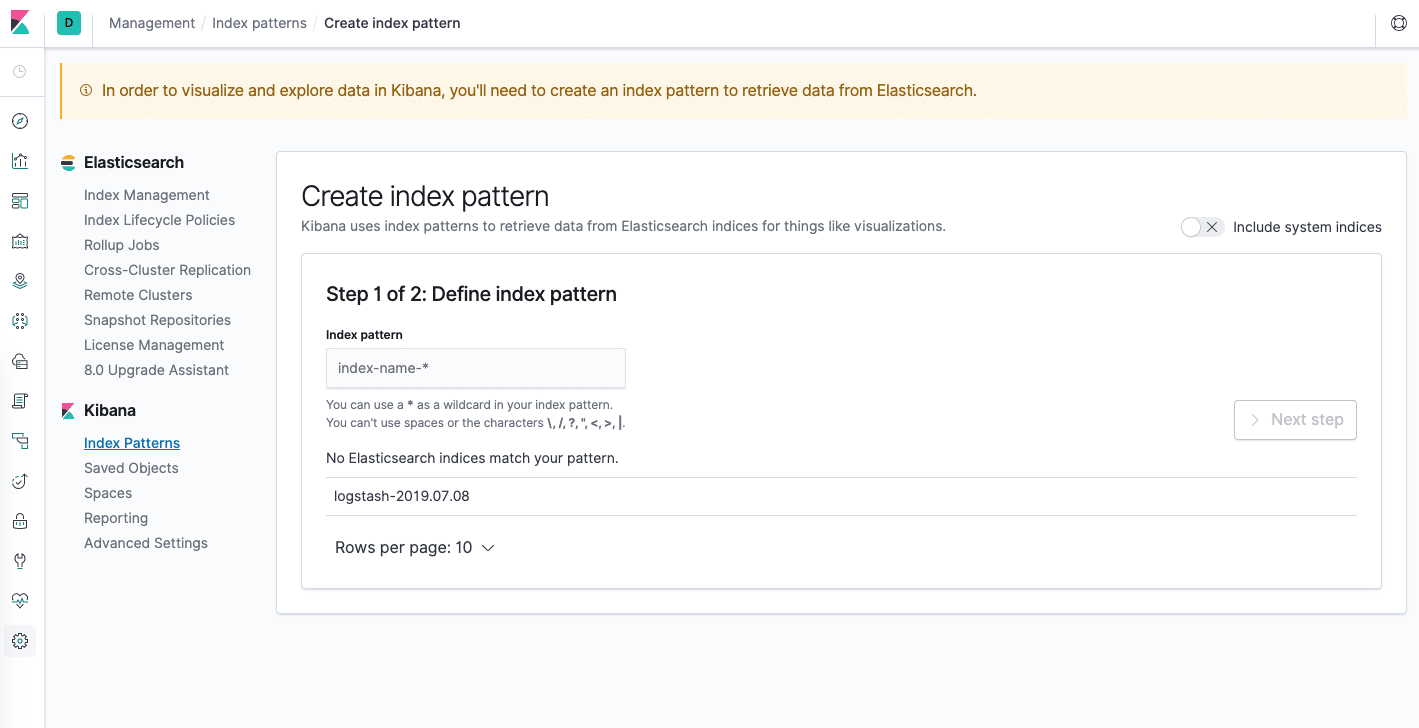
This allows you to define the Elasticsearch indices you’d like to explore in Kibana. To learn more, consult Defining your index patterns in the official Kibana docs. For now, we’ll just use the logstash-* wildcard pattern to capture all the log data in our Elasticsearch cluster. Enter logstash-* in the text box and click on Next step.
You’ll then be brought to the following page:
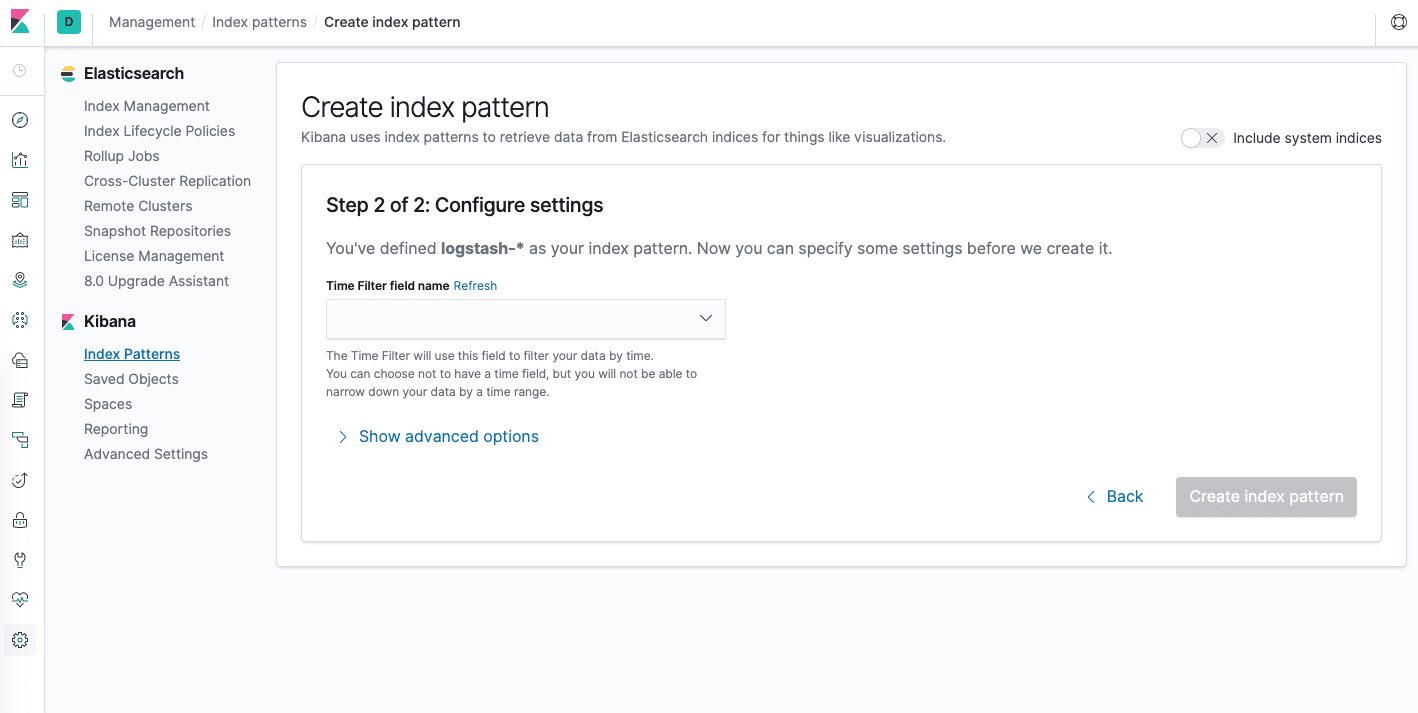
This allows you to configure which field Kibana will use to filter log data by time. In the dropdown, select the @timestamp field, and hit Create index pattern.
Now, hit Discover in the left hand navigation menu.
You should see a histogram graph and some recent log entries:
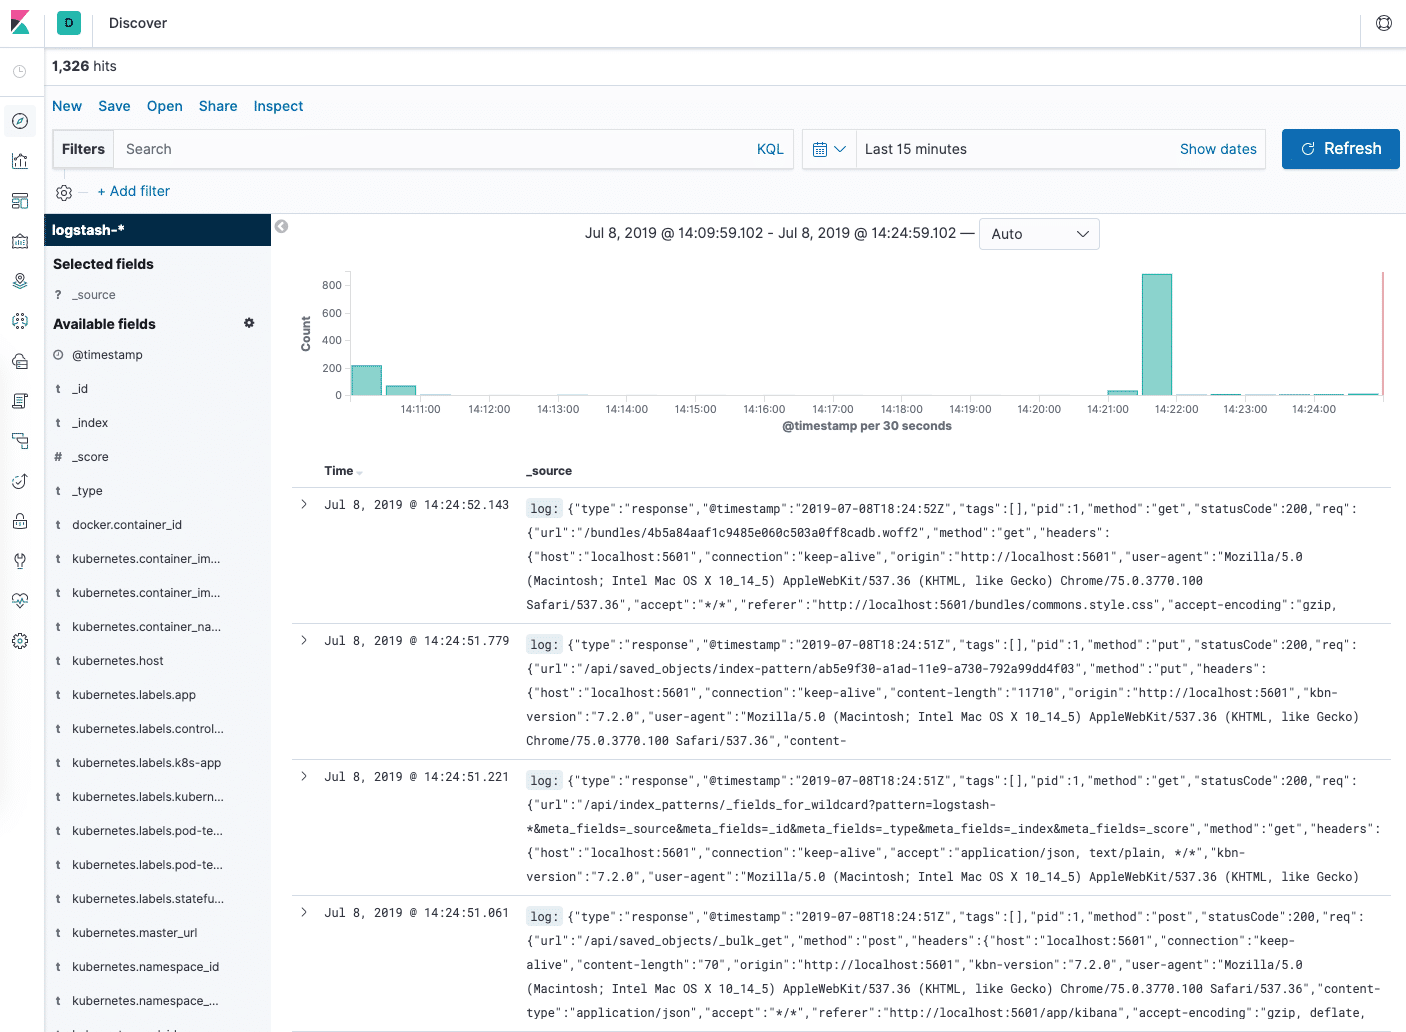
At this point you’ve successfully configured and rolled out the EFK stack on your Kubernetes cluster. To learn how to use Kibana to analyze your log data, consult the Kibana User Guide.
In the next optional section, we’ll deploy a simple counter Pod that prints numbers to stdout, and find its logs in Kibana.
Step 5 (Optional) — Testing Container Logging
To demonstrate a basic Kibana use case of exploring the latest logs for a given Pod, we’ll deploy a minimal counter Pod that prints sequential numbers to stdout.
Let’s begin by creating the Pod. Open up a file called counter.yaml in your favorite editor:
- nano counter.yaml
Then, paste in the following Pod spec:
This is a minimal Pod called counter that runs a while loop, printing numbers sequentially.
Deploy the counter Pod using kubectl:
From the Discover page, in the search bar enter kubernetes.pod_name:counter. This filters the log data for Pods named counter.
You should then see a list of log entries for the counter Pod:
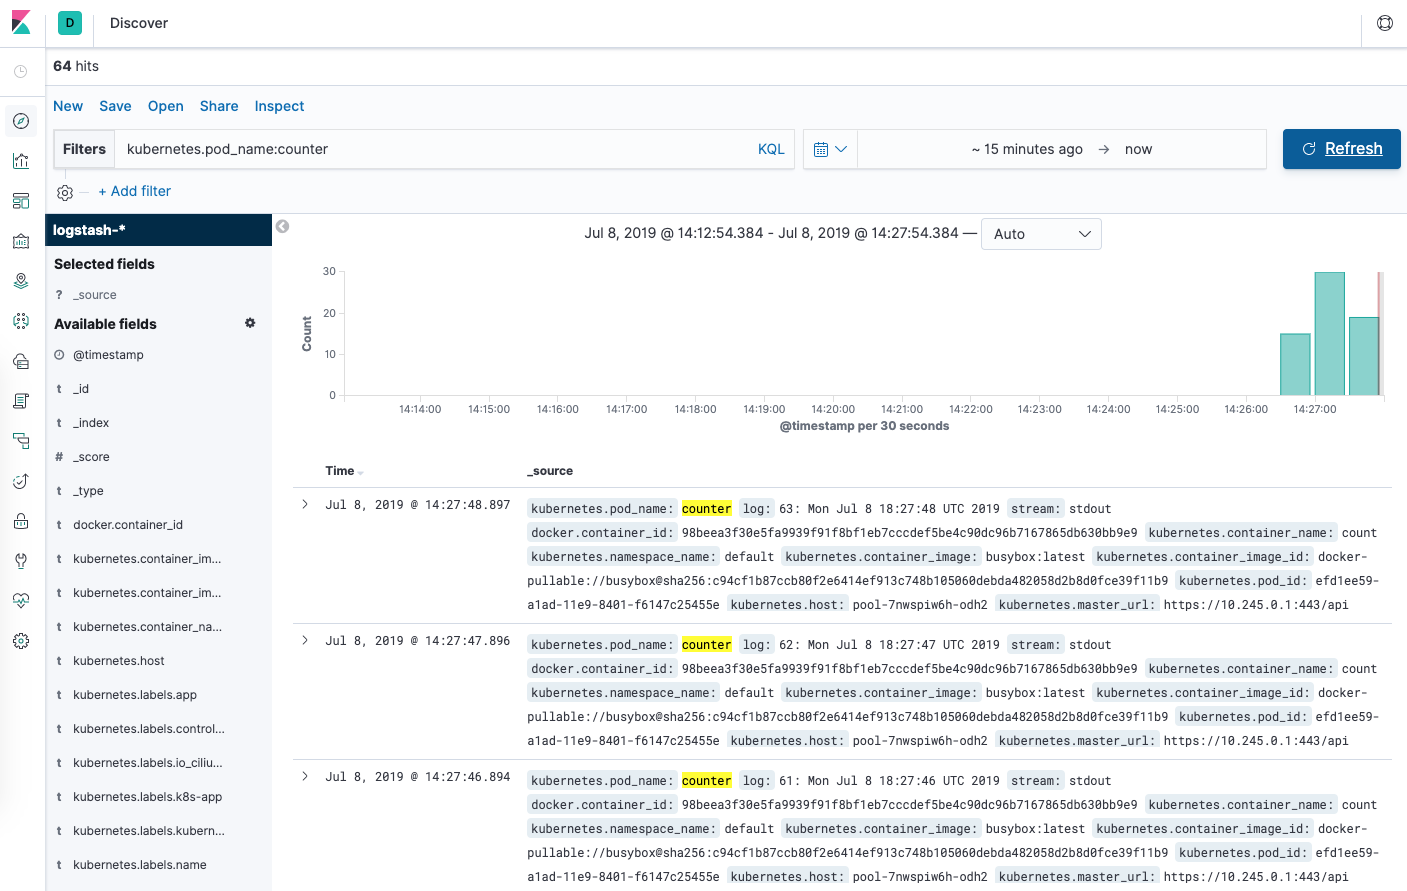
You can click into any of the log entries to see additional metadata like the container name, Kubernetes node, Namespace, and more.
Conclusion
In this guide we’ve demonstrated how to set up and configure Elasticsearch, Fluentd, and Kibana on a Kubernetes cluster. We’ve used a minimal logging architecture that consists of a single logging agent Pod running on each Kubernetes worker node.
Before deploying this logging stack into your production Kubernetes cluster, it’s best to tune the resource requirements and limits as indicated throughout this guide. You may also want to set up X-Pack to enable built-in monitoring and security features.
The logging architecture we’ve used here consists of 3 Elasticsearch Pods, a single Kibana Pod (not load-balanced), and a set of Fluentd Pods rolled out as a DaemonSet. You may wish to scale this setup depending on your production use case. To learn more about scaling your Elasticsearch and Kibana stack, consult Scaling Elasticsearch.
Kubernetes also allows for more complex logging agent architectures that may better suit your use case. To learn more, consult Logging Architecture from the Kubernetes docs.
Đăng ký liền tay Nhận Ngay Bài Mới
Subscribe ngay
Cám ơn bạn đã đăng ký !
Lỗi đăng ký !

![[Cập nhật] Lỗ hổng zero-day 10 điểm trong hệ điều hành tường lửa PAN-OS](https://congdonglinux.com/wp-content/uploads/2021/10/image_404-scaled.jpg)







Add Comment